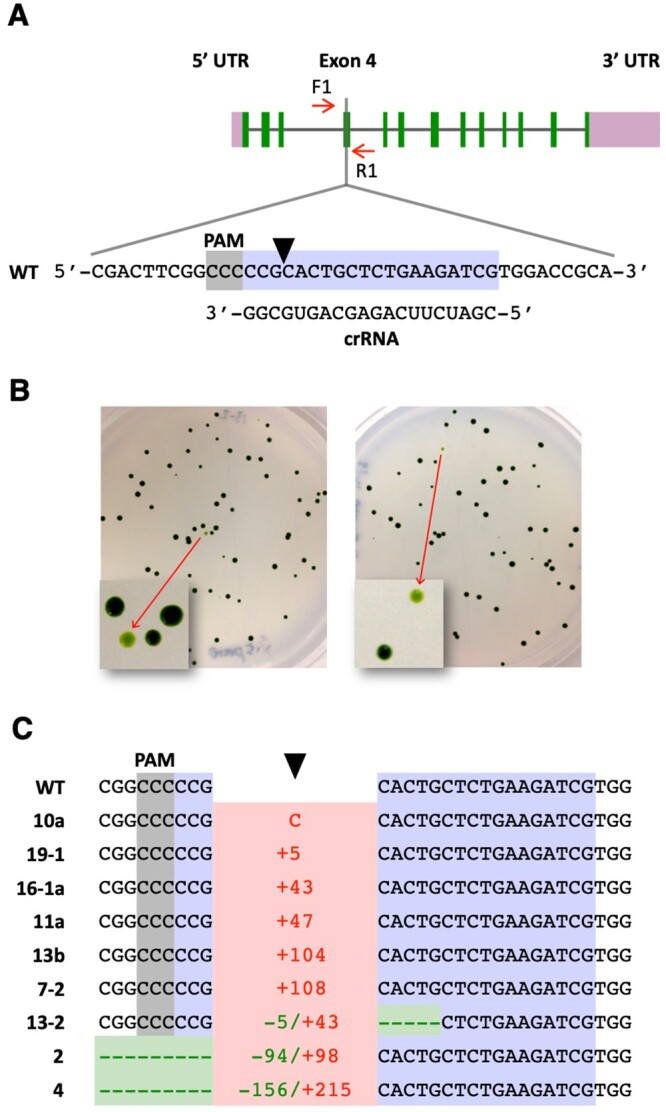
Figure 1.

Targeted disruption of the FTSY gene. A, Schematic of the FTSY gene showing the target (highlighted in bluish purple) and reverse complement PAM (highlighted in gray) sequences. A black arrowhead indicates the Cas9 cleavage site. Short red arrows indicate the primers used for PCR analyses. B, Cells co-transfected with the CRISPR/Cas9 (FTSY) RNP and dsDNA encoding the aphVIII transgene were spread on TAP agar plates containing paromomycin. Representative plates show some pale green colonies as a consequence of FTSY gene disruption. C, DNA sequences of pale green colonies, indicating alterations at the FTSY target site relative to the WT. Insertions, indicating type (C, cytosine) or number of base pairs, are depicted in red. Deletions, indicating type or number of base pairs, are depicted in green. Complete sequences are shown in Supplemental Figure S2.
