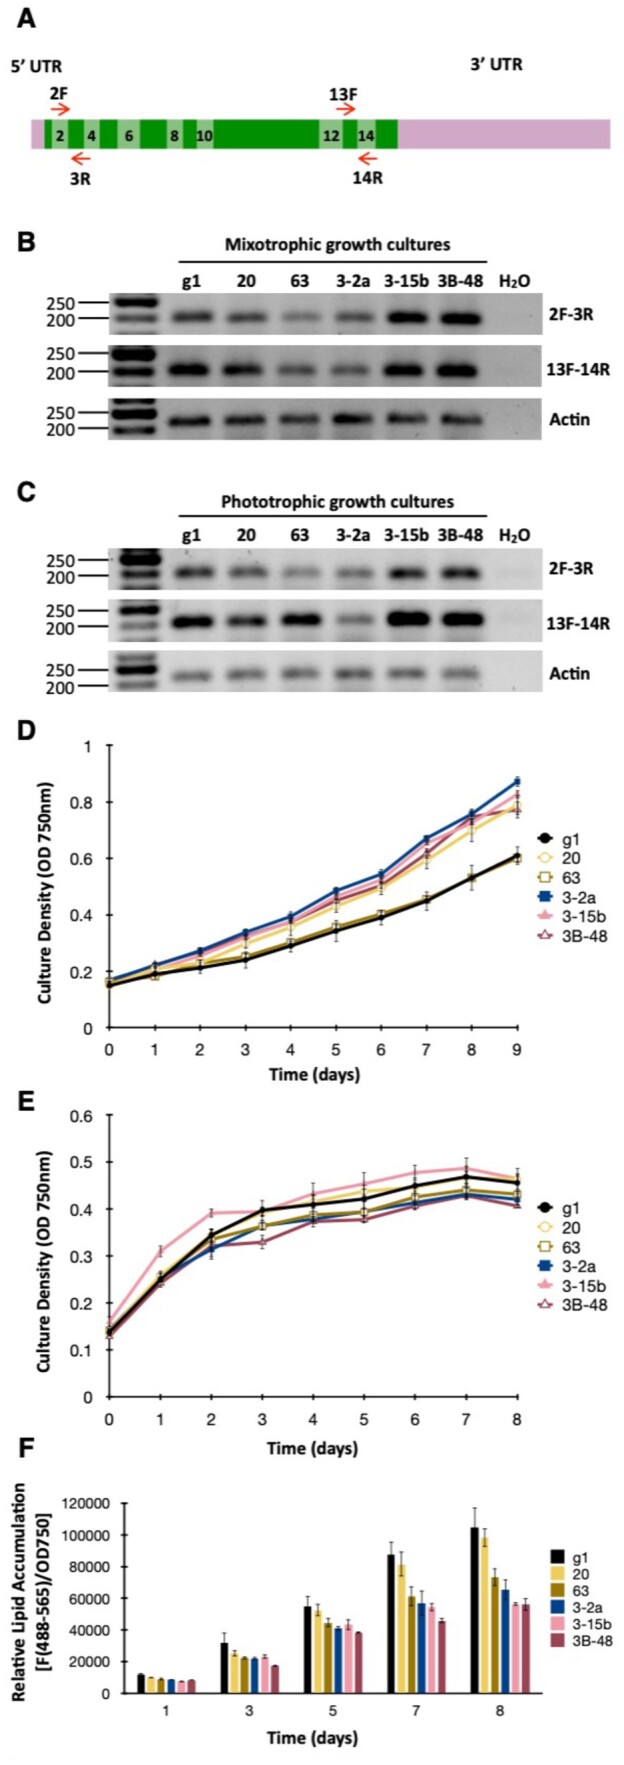
Figure 5.

Phenotypic characterization of WDTC1 mutants generated by CRISPR/Cas9 editing. A, Schematic of the WDTC1 transcript. Exons are depicted as boxes in two alternating shades of green and even exons are numbered. Short red arrows indicate the primers used for semi-quantitative RT-PCR analyses. B, WDTC1 transcript abundance examined by semiquantitative RT-PCR in cells grown under mixotrophic conditions. The panels show representative reverse images of agarose resolved RT-PCR products stained with ethidium bromide. Amplification of the Actin transcript was used for normalization purposes. The sizes of molecular weight markers are indicated in base pairs. g1, WT strain. C, WDTC1 transcript abundance examined by semiquantitative RT-PCR in cells grown under phototrophic conditions. D, Growth of the indicated strains under phototrophic conditions in nutrient replete minimal medium. Values shown are the average of three biological replicates ± sd. E, Growth of the indicated strains under mixotrophic conditions in nitrogen deprived medium (TAP-N). Values shown are the average of three biological replicates ± sd. F, Nonpolar lipid accumulation in the indicated strains cultured under mixotrophic conditions in TAP medium lacking nitrogen. Nonpolar lipid content was estimated by staining with the lipophilic fluorophore Nile Red and measuring fluorescence (excitation at 488 nm; emission at 565 nm) in a multiwell plate reader. Nile Red fluorescence was normalized to cell density (determined as absorbance at 750 nm) and expressed in arbitrary units. Values shown are the average of three biological replicates ± sd.
