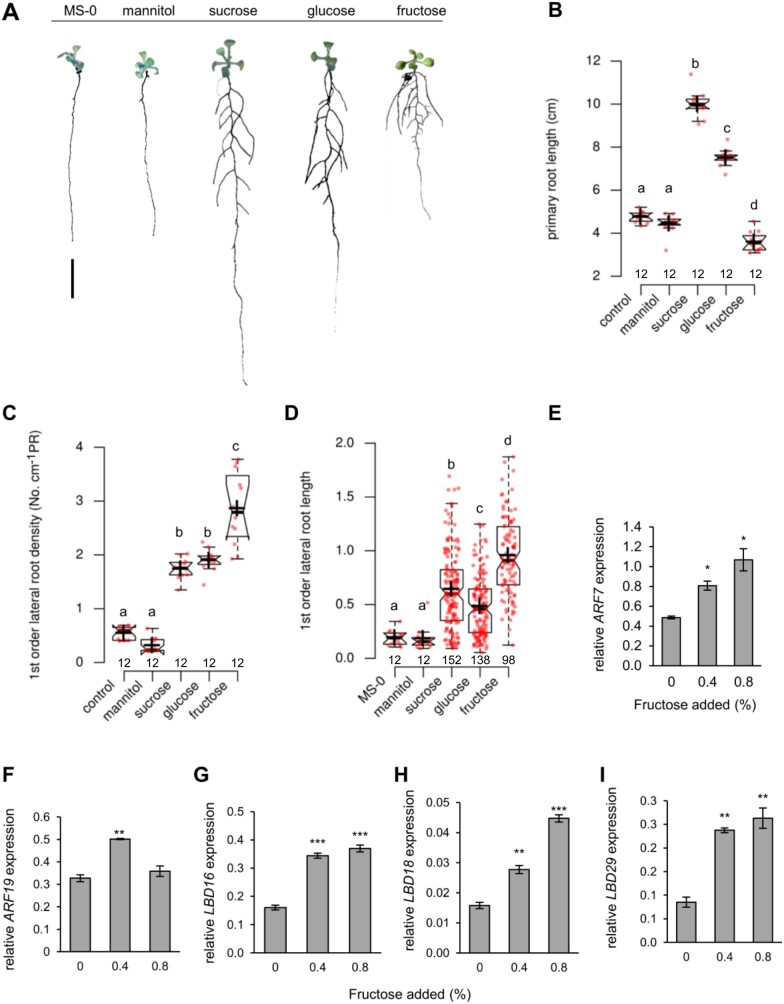
Figure 1.
Plasticity of root growth of WT plants in response to different sugars. A, Representative pictures of plants grown on MS agar plates without (control) or supplemented with 0.8% of corresponding sugars or mannitol and grown for 10 d. Bar = 1 cm (B) PR length (C) First order LR density of plants grown with different sugars (D) First order LR length. Different letters above boxes denote significant differences according to one-way ANOVA with post-hoc Tukey HSD test (P < 0.05). Center lines within boxes show the medians; crosses show means; box limits indicate the 25th and 75th percentiles; whiskers extend 1.5 times the interquartile range (IQR) from the 25th and 75th percentiles, outliers are represented by dots. Notches are defined as ±1.58 × IQR/sqr(n) and represent the 95% confidence interval for each median. Numbers below boxes indicate sample size. E–I, Fructose-dependent expression of transcription factor genes involved in LR formation in WT plants. Seeds were germinated and plants grown on MS agar plates supplemented with the indicated fructose concentrations. Roots from 2-week-old seedlings were used for gene expression analysis. Bars are means from n = 3 replicates. Each replicate represents pooled roots from eight plants. Error bars are SE (one‐way ANOVA/Duncan P < 0.05) and asterisks indicate significant differences in comparison to control (0% fructose added). Expression levels of ARF7 (E), ARF19 (F), LBD16 (G), LBD18 (H), and LBD29 (I) are shown.

