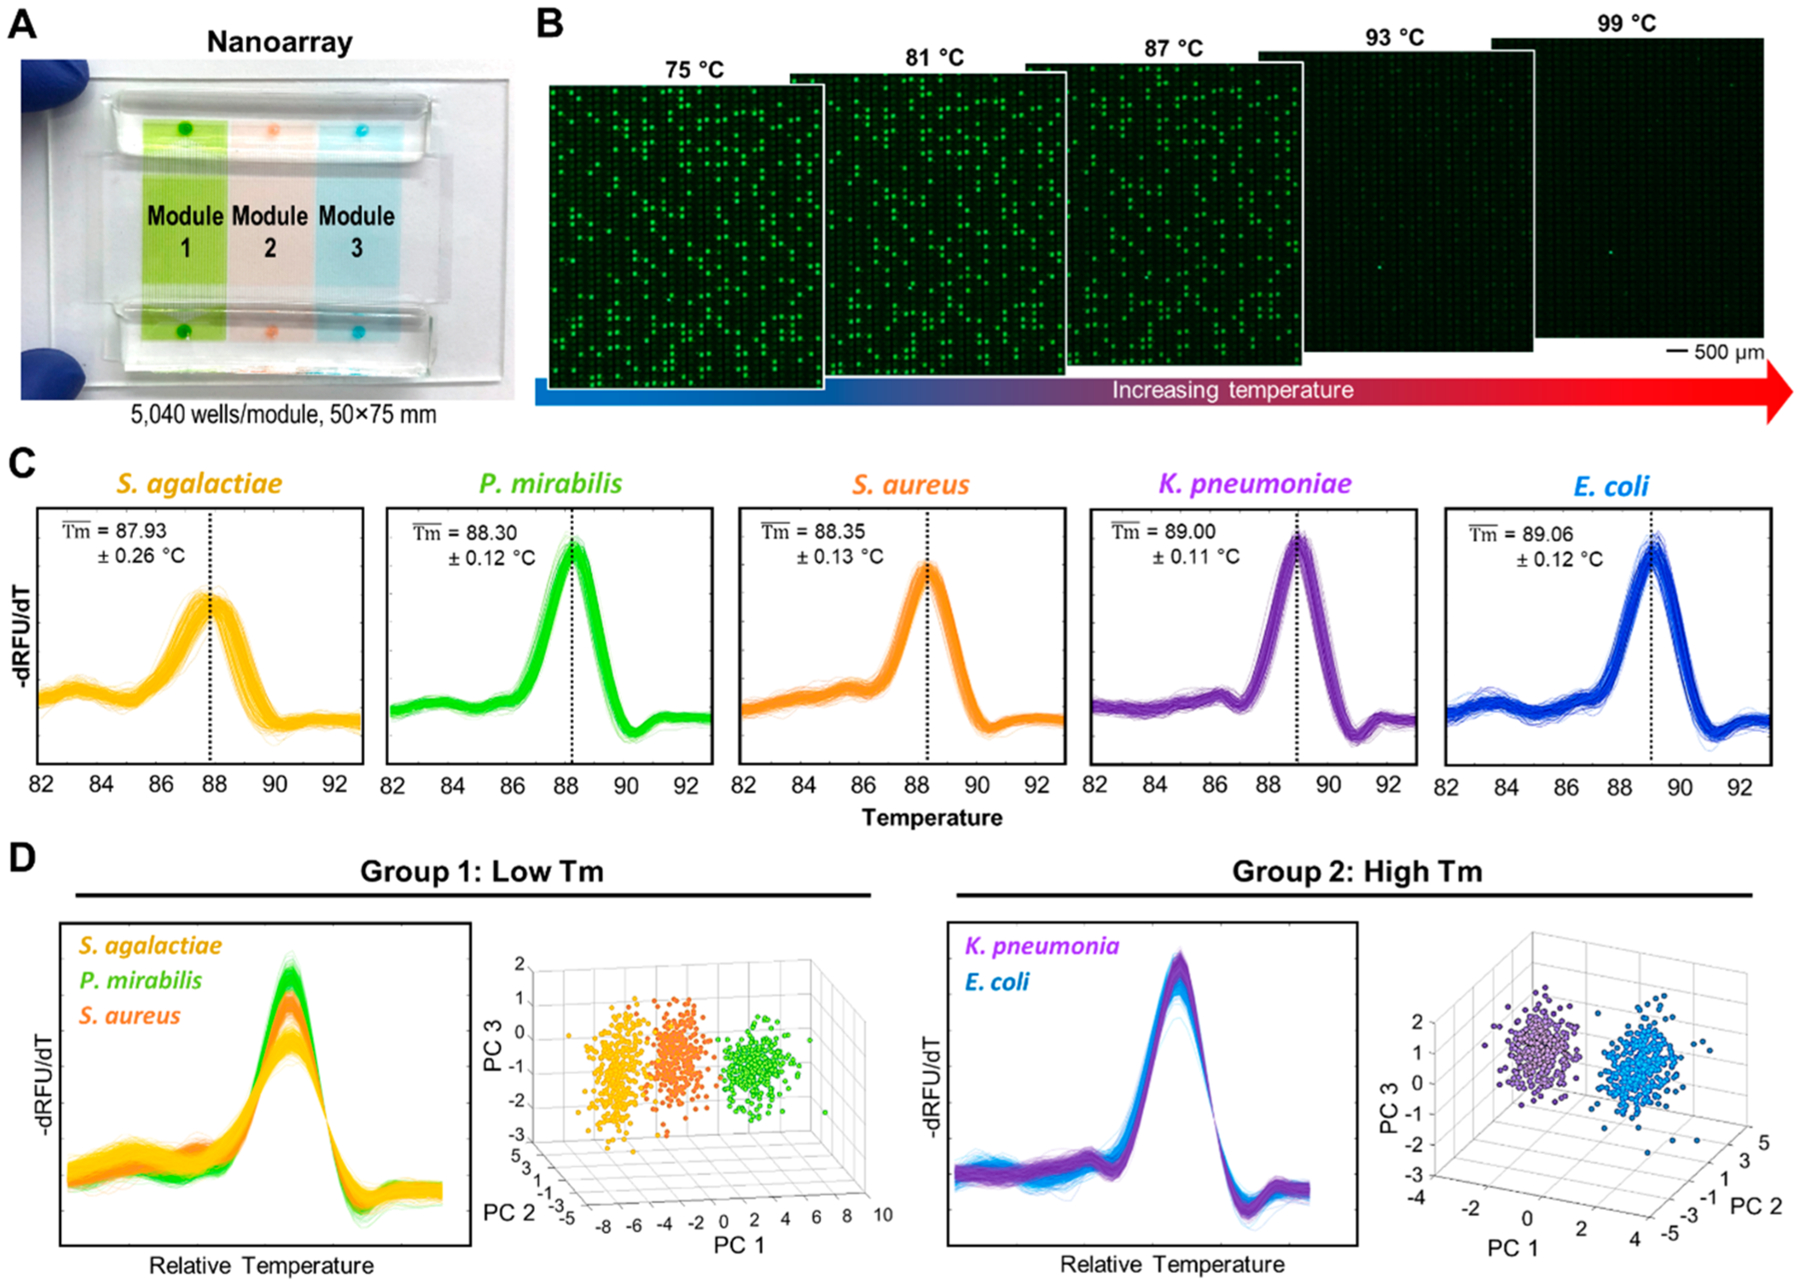
Figure 2.

Bacteria ID via dPCR–HRM in the nanoarray and machine-learning-assisted digital melt curve identification. (A) Each nanoarray device contains three independent modules; each houses 5040 1 nL nanowells. (B) During dHRM, double-stranded dPCR products in these strongly fluorescent, positive wells become increasingly melted as temperature increases, resulting in decreasing fluorescence intensities in these nanowells. (C) A total of 320 digital melt curves from five species of bacteria commonly found in urinary tract infections—S. agalactiae, P. mirabilis, S. aureus, K. pneumoniae, and E. coli—are collected to build a digital melt curve database toward broad bacteria ID. (D) To achieve reliable bacteria ID, both the melting temperature (Tm) and the shape of the digital melt curves are used for analysis. On the basis of Tm, our digital melt curve database is divided into the low-Tm group with S. agalactiae, P. mirabilis, and S. aureus and the high-Tm group with K. pneumoniae and E. coli. Within each Tm group, digital melt curves are aligned to a single point to facilitate shape-based digital melt curve analysis before a one-versus-one support vector machine algorithm is used to compare species-specific melt curve shapes and identify bacterial species. Principle component analysis using the first three principle components (i.e., PC1, PC2, and PC3) is performed to visualize that the digital melt curves from each species indeed cluster into distinguishable populations.
