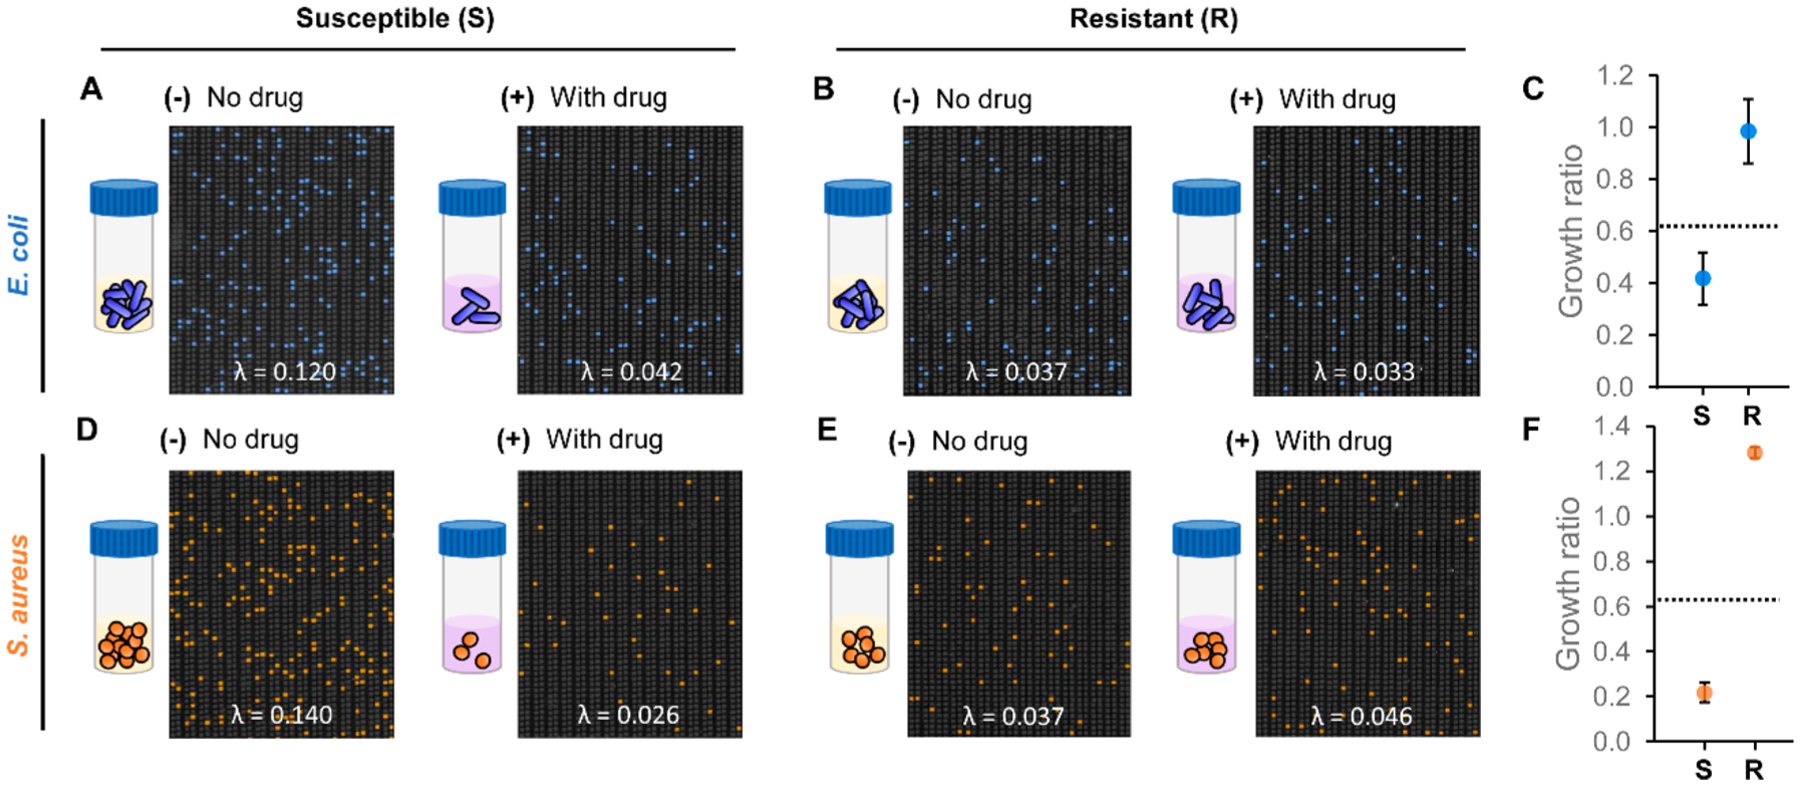
Figure 4.

Characterization of pheno–molecular AST with dPCR–HRM-based quantitative analysis in the nanoarray. After 30 min of incubation (A) for susceptible E. coli, significantly more E. coli DNA is measured from the no-gentamicin control aliquot than the gentamicin-treated sample aliquot. (B) For resistant E. coli, comparable amounts of E. coli DNA are measured from both aliquots. (C) The “growth ratios” of susceptible E. coli and resistant E. coli are calculated from the ratio between λ of the gentamicin-treated sample and λ of the no-gentamicin control from duplicate experiments. In the growth ratio plot, the dashed line represents the susceptibility threshold for determining whether the bacteria strain is susceptible (S) or resistant (R) to gentamicin. Similar results are observed for S. aureus in panels D and E. (F) The growth ratios from duplicate experiments of susceptible S. aureus and resistant S. aureus correctly fall below and above the susceptibility threshold.
