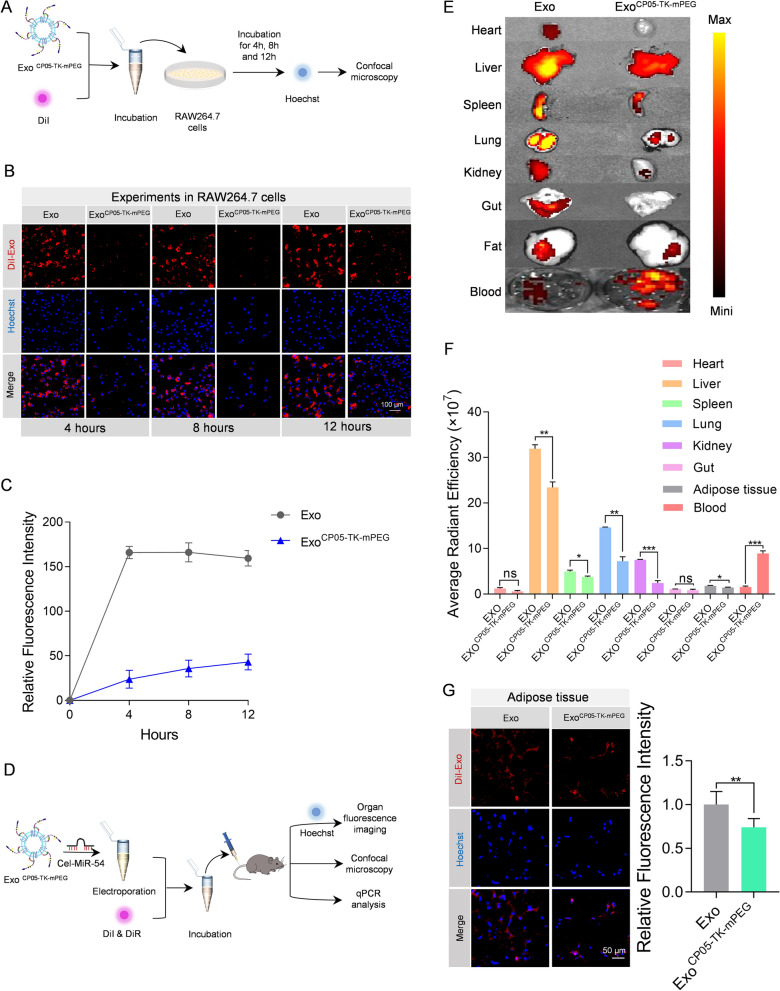
Fig. 2.
ExoCP05−TK−mPEG escape from phagocytosis both in vitro and in vivo. A Schematic illustration of the in vitro experimental procedures. ExoCP05−TK−mPEG was stained with DiI and put into Raw 264.7 cells incubating for 4 h, 8 h, and 12 h for confocal images. B Representative confocal images of DiI-labeled exosomes (red) in RAW264.7 cells. The nuclei were counter-stained with Hoechst (blue). DiI-labeled exosomes were added to RAW264.7 cells and incubated for 4 h, 8 h, and 12 h before fluorescence microscopy. C Relative fluorescence intensities of the confocal images at 4 h, 8 and 12 h. D Schematic illustration of the in vivo experimental procedures. Exo CP05−TK−mPEG was loaded with cel-miR-54 then stained with DiI or DiR for organ fluorescence imaging, confocal microscopy and qPCR analysis. E Representative fluorescence showing the localization of DiR-labeled exosomes in various organs and blood in mice treated with Exo and Exo CP05−TK−mPEG. F Average radiant efficiency for above images. G Representative confocal images of DiI-labeled exosomes (red) in abdominal adipose tissue of mice. The nuclei of adipose cells were counter-stained with Hoechst (blue). The relative fluorescence intensity was shown at right panel. All data are expressed as mean ± SEM. *p < 0.05, **p < 0.01, ***p < 0.001 between groups. Error bars represent the SEM for n = 3

