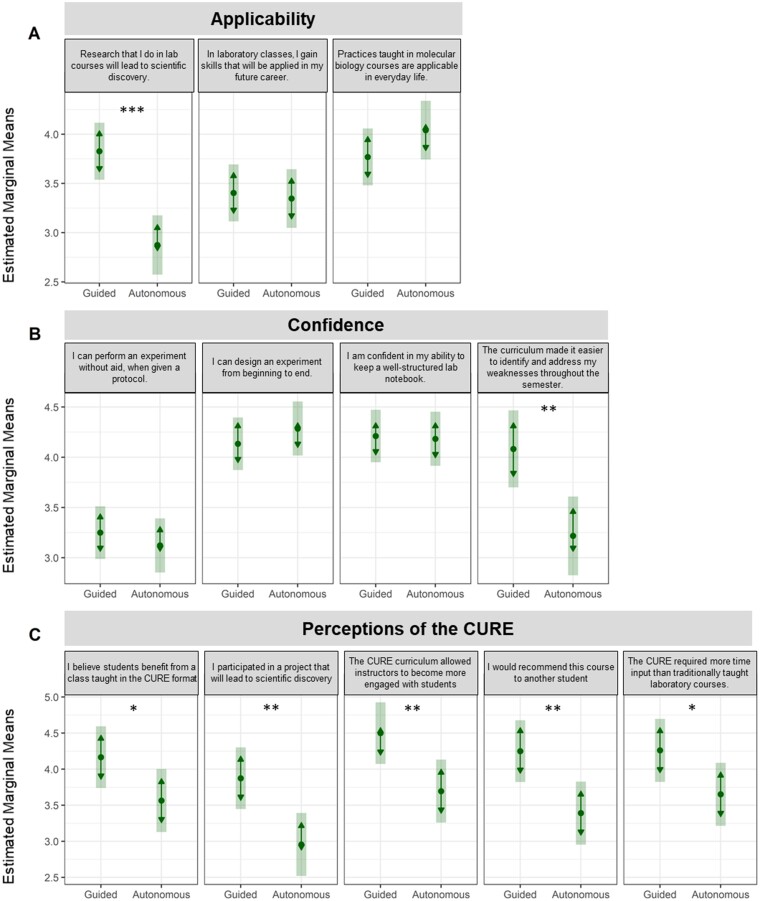
Fig. 1.
Student post-survey gains. Student measures of gains in applicability, confidence, and perceptions of the CURE were compared between the Guided and Autonomous Formats. Least squared means were plotted with 95% CI displayed by shaded regions, and arrows represent comparisons among the means, with overlapping arrows indicating non-significance based on Tukey P-value adjustments (Lenth et al. 2021). Statistical significance is noted by an asterisk (*<0.05, ** <0.01, ***<0.001). Only statistically significant measures were plotted for the CURE format. See Table 2 for comprehensive post-survey response comparisons.

