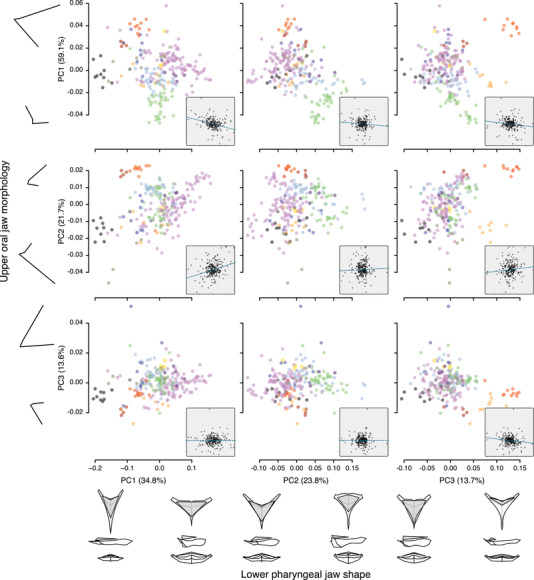
Figure 2.

Correlations among principal components (PC1–PC3) of lower pharyngeal jaw shape (x‐axes) and oral jaw morphology (y‐axes). Data points are species means colored according to tribe (see Fig. 3). For each PC axis, the percentage of explained variance is provided in brackets and the associated shape changes (minimum and maximum) are shown. The insets display the evolutionary correlations of phylogenetically independent contrasts calculated for the PC scores (see Fig. S6 for fully sized plots).
