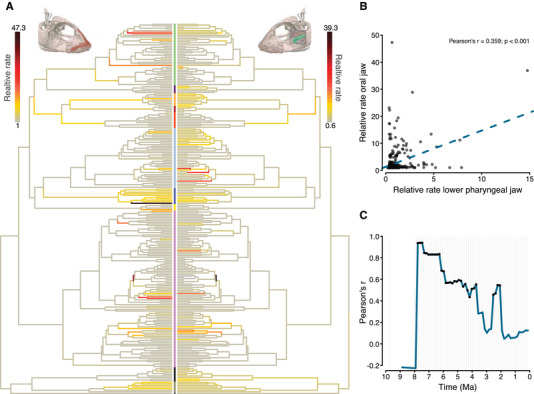
Figure 4.

(A) Relative evolutionary rates of the first three PC axes of oral jaw morphology (left panel) and lower pharyngeal jaw shape (right panel) over the course of the adaptive radiation of cichlid fishes in Lake Tanganyika. Colors at the tips of the phylogenies correspond to the tribes (see Fig. S3). (B) Correlation of branch‐specific relative rates between the two jaws across the radiation. (C) Correlation coefficients of relative evolutionary rates between the two jaws through time (see also Figs. S3 and S4). Black dots indicate correlation coefficients that have an associated P‐value below 0.05.
