Fig. 1.
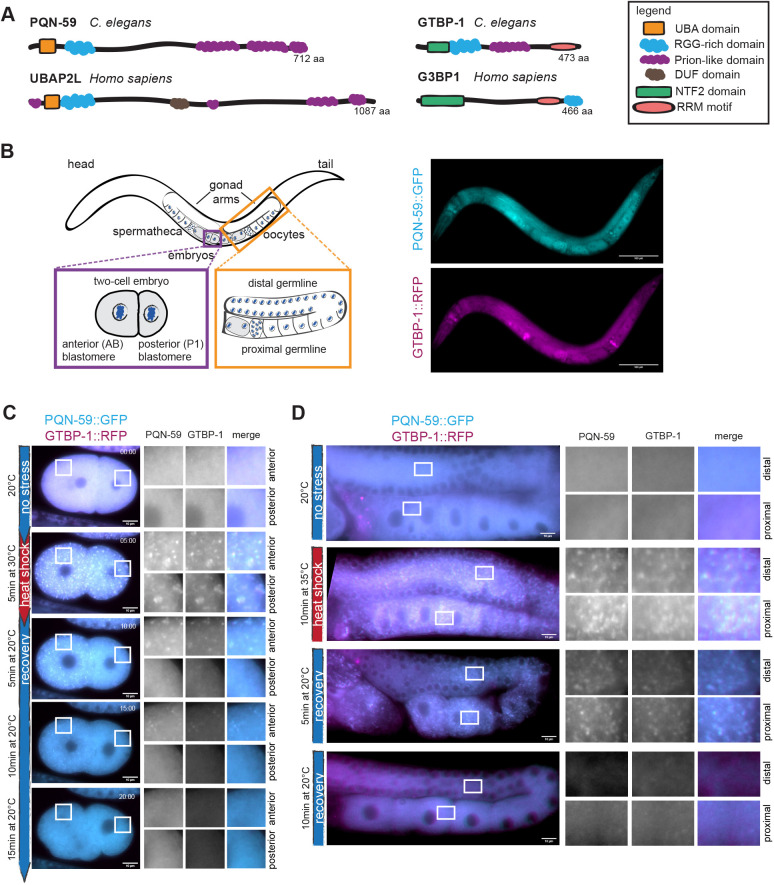
PQN-59 and GTBP-1 colocalize into heat-stress-induced granules in the embryo and in the germline. (A) Schematic representation of the protein domains of PQN-59 and of GTBP-1 and their human orthologs, UBAP2L and G3BP1. (B) Left, schematic drawing of an adult C. elegans worm, with close ups of a two-cell embryo (purple square) and of the germline (orange square) . Right, images of an adult animal expressing endogenous pqn-59::GFP;gtbp-1::RFP. PQN-59 is in cyan, GTBP-1 in magenta. Scale bars: 100 μm. (C) Still frames from time-lapse imaging of pqn-59::GFP;gtbp-1::RFP embryos using the CherryTemp temperature-controlled stage. PQN-59 (cyan) and GTBP-1 (magenta) granules were observed in 100% of the observed embryos (n=12, N=3). Embryos imaging started at 20°C (no stress), the temperature was switched at 30°C (heat shock) and then back to 20°C for the indicated time. The red vertical line on the left shows the time of exposure to heat shock and the blue line the time after stress release (recovery). In all figures, white boxes indicate the ROI shown enlarged on the right. For embryos, ROIs are in the anterior AB cell (top) and in the posterior P1 cell (bottom). (D) Germlines of pqn-59::GFP;gtbp-1::RFP worms in control conditions (no stress, 20°C, n=5, N=3) after heat-stress exposure (10 min at 35°C, n=30, N=3), after 5 and 10 min recovery (n=29 and n=20, respectively, N=3). PQN-59 (cyan) and GTBP-1 (magenta) form cytoplasmic granules after 10 min of heat exposure at 35°C (red vertical line) and dissolve after 10 min of recovery at 20°C (blue vertical line). In all images of germlines, white boxes in the distal (top) and proximal (bottom) germline show the ROI enlarged on the right. In B–D an epifluorescence microscope was used. Scale bars: 10 μm. In all images, ROIs are enlarged 8× (embryos) and 11.5× (germline). n indicates the number of samples and N the number of independent experiments.

