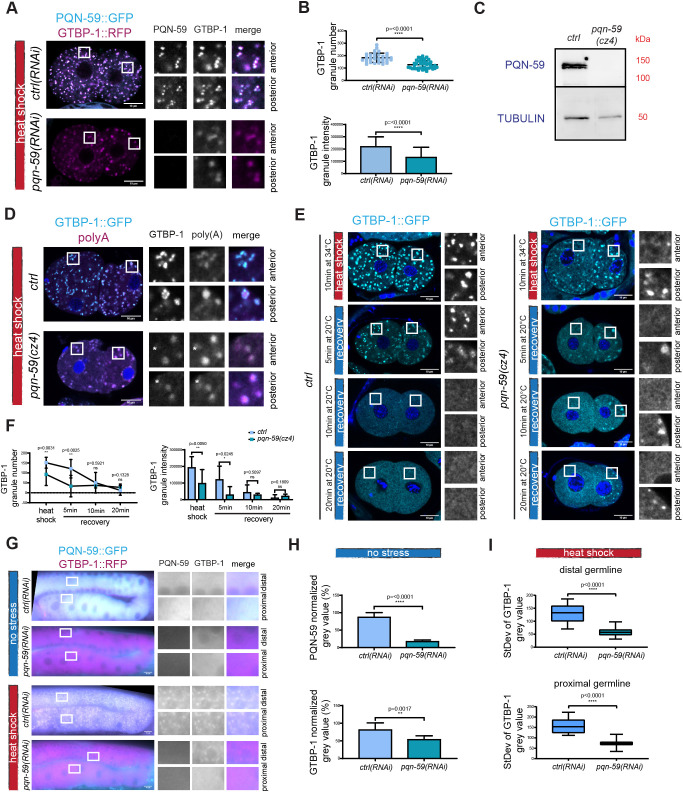
Fig. 3.
PQN-59 RNAi depletion results in a reduced number of GTBP-1 stress-induced granules. (A) Single confocal planes of pqn-59::GFP;gtbp-1::RFP fixed two-cell embryos treated with ctrl or pqn-59 RNAi and exposed to heat shock (34°C for 10 min) before fixation. (B) Quantification of the GTBP-1 granule number (top) and the average GTBP-1 granule intensity (bottom) per embryo. ctrl(RNAi) n=33; pqn-59(RNAi) n=44. N=4. (C) Western blot on worm lysates of gtbp-1::GFP (ctrl) and pqn-59(cz4);gtbp-1::GFP worms using anti-PQN-59 and anti-tubulin (loading control) antibodies. N=2. (D) Single confocal planes of gtbp-1::GFP and pqn-59(cz4);gtbp-1::GFP fixed embryos subjected to FISH for poly(A) RNAs. GTBP-1 GFP signal is in cyan, the poly(A) signal is in magenta and DNA was counterstained with DAPI (blue). Asterisks in the inset indicate poly(A) granules that have very weak or no GTBP-1 signal. ctrl n=21, pqn-59(cz4);gtbp-1::GFP. n=13. N=2. (E) Single confocal planes of gtbp-1::GFP (ctrl) and pqn-59(cz4);gtbp-1::GFP (pqn-59(cz4)) fixed embryos. GTBP-1 GFP signal is in cyan and DNA was counterstained with DAPI (blue). Embryos were fixed at different time points: immediately after heat-shock exposure (10 min at 34°C) and after recovery at 20°C for 5, 10, or 20 min. (F) Quantifications of the dissolution shown in E (left, number of granules at the different time points and, right, of the intensity of the granules. ctrl: n=12 (HS), n=12, n=16, n=12 (5, 10 and 20 min recovery, respectively); pqn-59(cz4): n=9 (HS), n= 7, n=7, n=8 (5, 10 and 20 min recovery, respectively). N=4. (G) Epifluorescence microscope images of germlines of pqn-59::GFP;gtbp-1::RFP of control or PQN-59 depleted worms, not exposed (top) or exposed (bottom) to heat shock. (H) Quantifications of the cytoplasmic levels of PQN-59 (top) and GTBP-1 (bottom) in the distal germline of non-stressed worms. ctrl(RNAi) n=10; pqn-59(RNAi) n=11. N=2. (I) Quantification of the standard deviation of the GTBP-1 gray value in control (n=13) and pqn-59(RNAi) (n=15) distal (top) and proximal (bottom) germlines. N=2. Error bars indicate s.d. P-values were determined using a two-tailed, unpaired Student's t-test. n indicates the number of samples and N the number of independent experiments. Scale bars: 10 μm. Enlarged ROIs are on the right.

