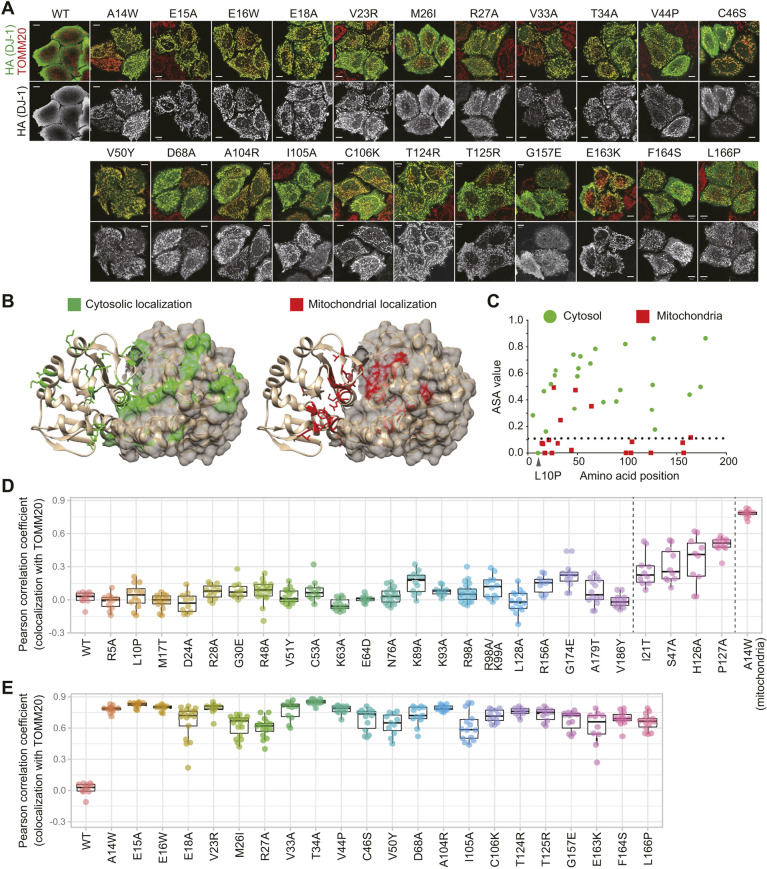
Fig. 1.
Mutations buried in the DJ-1 structure responsible for mitochondrial localization. (A) Mitochondrial localization of newly identified DJ-1 mutants. Top images, merged images for the DJ-1 construct signal (HA, green) and the mitochondrial marker TOMM20 (red) in DJ-1-knockout cells; bottom images, DJ-1 construct signal alone. Representative images of two independent experiments are shown. Scale bars: 10 µm. (B) Location of the mutation sites in relation to the DJ-1 dimer structure are shown. One DJ-1 monomer is shown in ribbon format, whereas the other is shown in surface mode. (C) Values for the accessible surface area (ASA), equivalent to solvent accessibility of each amino acid, are shown. Amino acid sites linked to mitochondrial localization are shown in red, whereas those associated with cytosolic localization are shown in green. With the exception of L10P, all of the DJ-1 mutations in the buried structure (ASA value <0.1) cause mitochondrial localization. (D,E) For quantitative analysis, the colocalization of DJ-1 mutants with the mitochondrial marker TOMM20 was calculated as a Pearson correlation coefficient in individual cells. (D) Cytosolic DJ-1 mutants; (E) mitochondrial mutants. Box plots are as described in the Materials and Methods section.

