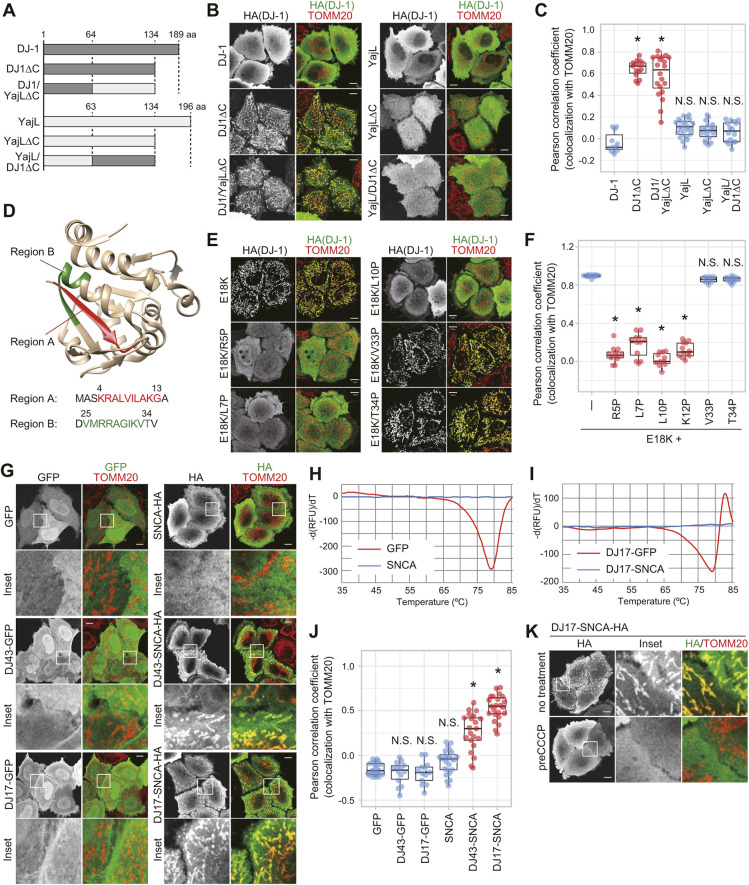
Fig. 6.
DJ-1 has a cryptic N-terminal MTS that is essential for mitochondrial localization. (A) Schematic diagram of the DJ-1 and YajL chimeric constructs. (B) Subcellular localization of the chimeric proteins in DJ-1 knockout cells. (C) Quantitative analysis of data shown in B. The colocalization of various chimeric proteins with the mitochondrial marker TOMM20 was calculated as a Pearson correlation coefficient in individual cells. (D) Sequence of regions A (red) and B (green) and their location in the DJ-1 structure. Those regions were detected by determining the PA score used in MitoFates. (E) Proline mutations in region A of the E18K mutant inhibit mitochondrial localization in DJ-1-knockout cells, whereas the same mutations in region B had no effect on mitochondrial localization. (F) Quantitative analysis of data shown in E. The colocalization of DJ-1 mutants with TOMM20 was calculated as a Pearson correlation coefficient in individual cells. (G) The subcellular localization of GFP and α-synuclein (SNCA) when fused with amino acids 1–43 (DJ43) or 1–17 (DJ17) of DJ-1. SNCA is targeted to the mitochondria when fused with the DJ-1 MTS, whereas the same MTS had no effect on GFP localization. (H,I) Thermal spectra of GFP and SNCA (H) or DJ17–GFP and DJ17–SNCA (I). Negative peaks in the thermal spectra indicate high melting temperatures (Tm) for GFP and DJ17–GFP, whereas the absence of peaks in SNCA and DJ17–SNCA suggests they are intrinsically disordered proteins. (J) Quantitative analysis of G. The colocalization of chimeric proteins with TOMM20 was calculated as a Pearson correlation coefficient in individual cells. (K) Uncoupler treatment inhibited the mitochondrial localization of DJ17–SNCA. In B, E, G and K, representative images of two independent experiments are shown. The left images show localization of the specific chimeric or mutant proteins alone, whereas images to the right show merged images for the chimeric or mutant proteins (green) and TOMM20 (red). *P<0.01, N.S., not significant compared to control (one-way ANOVA with Sidak's correction). Box plots are as described in the Materials and Methods section. Scale bars: 10 µm.

