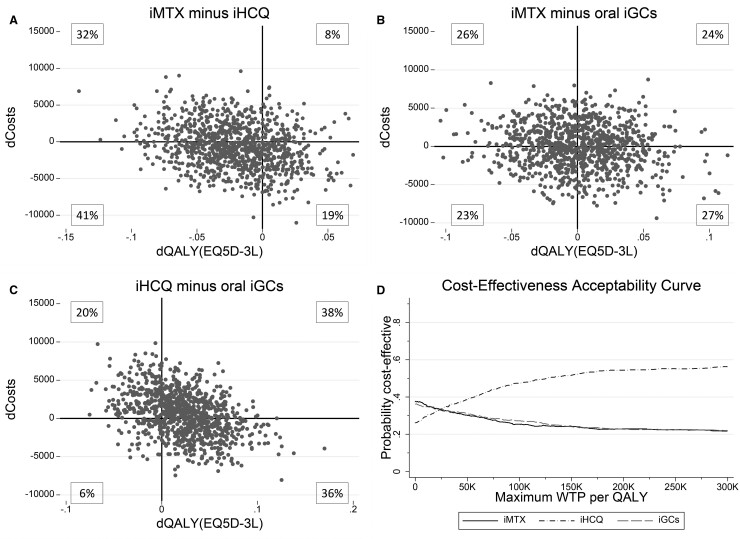
Fig. 2.
Summary of economic evaluation
(A–C) Results of 1000 bootstrapped replications, presented in cost-effectiveness planes indicating the uncertainty of the ICER for the comparison of the three initial treatment strategies. Differences in costs and differences in QALYs are indicated for the comparison of (A) iMTX minus iHCQ, (B) iMTX minus oral iGCs and (C) iHCQ minus oral iGCs. (D) The cost-effectiveness acceptability curve indicates the probability of being cost-effective at several levels of willingness to pay per QALY for the three separate initial treatment strategies. EQ5D-3L: European Quality of Life 5-Dimensions 3 Levels; ICER: incremental cost-effectiveness ratio; iGCs: initial glucocorticoids; iHCQ: initial HCQ; iMTX: initial MTX; QALY: quality-adjusted life year; WTP: willingness-to-pay.

