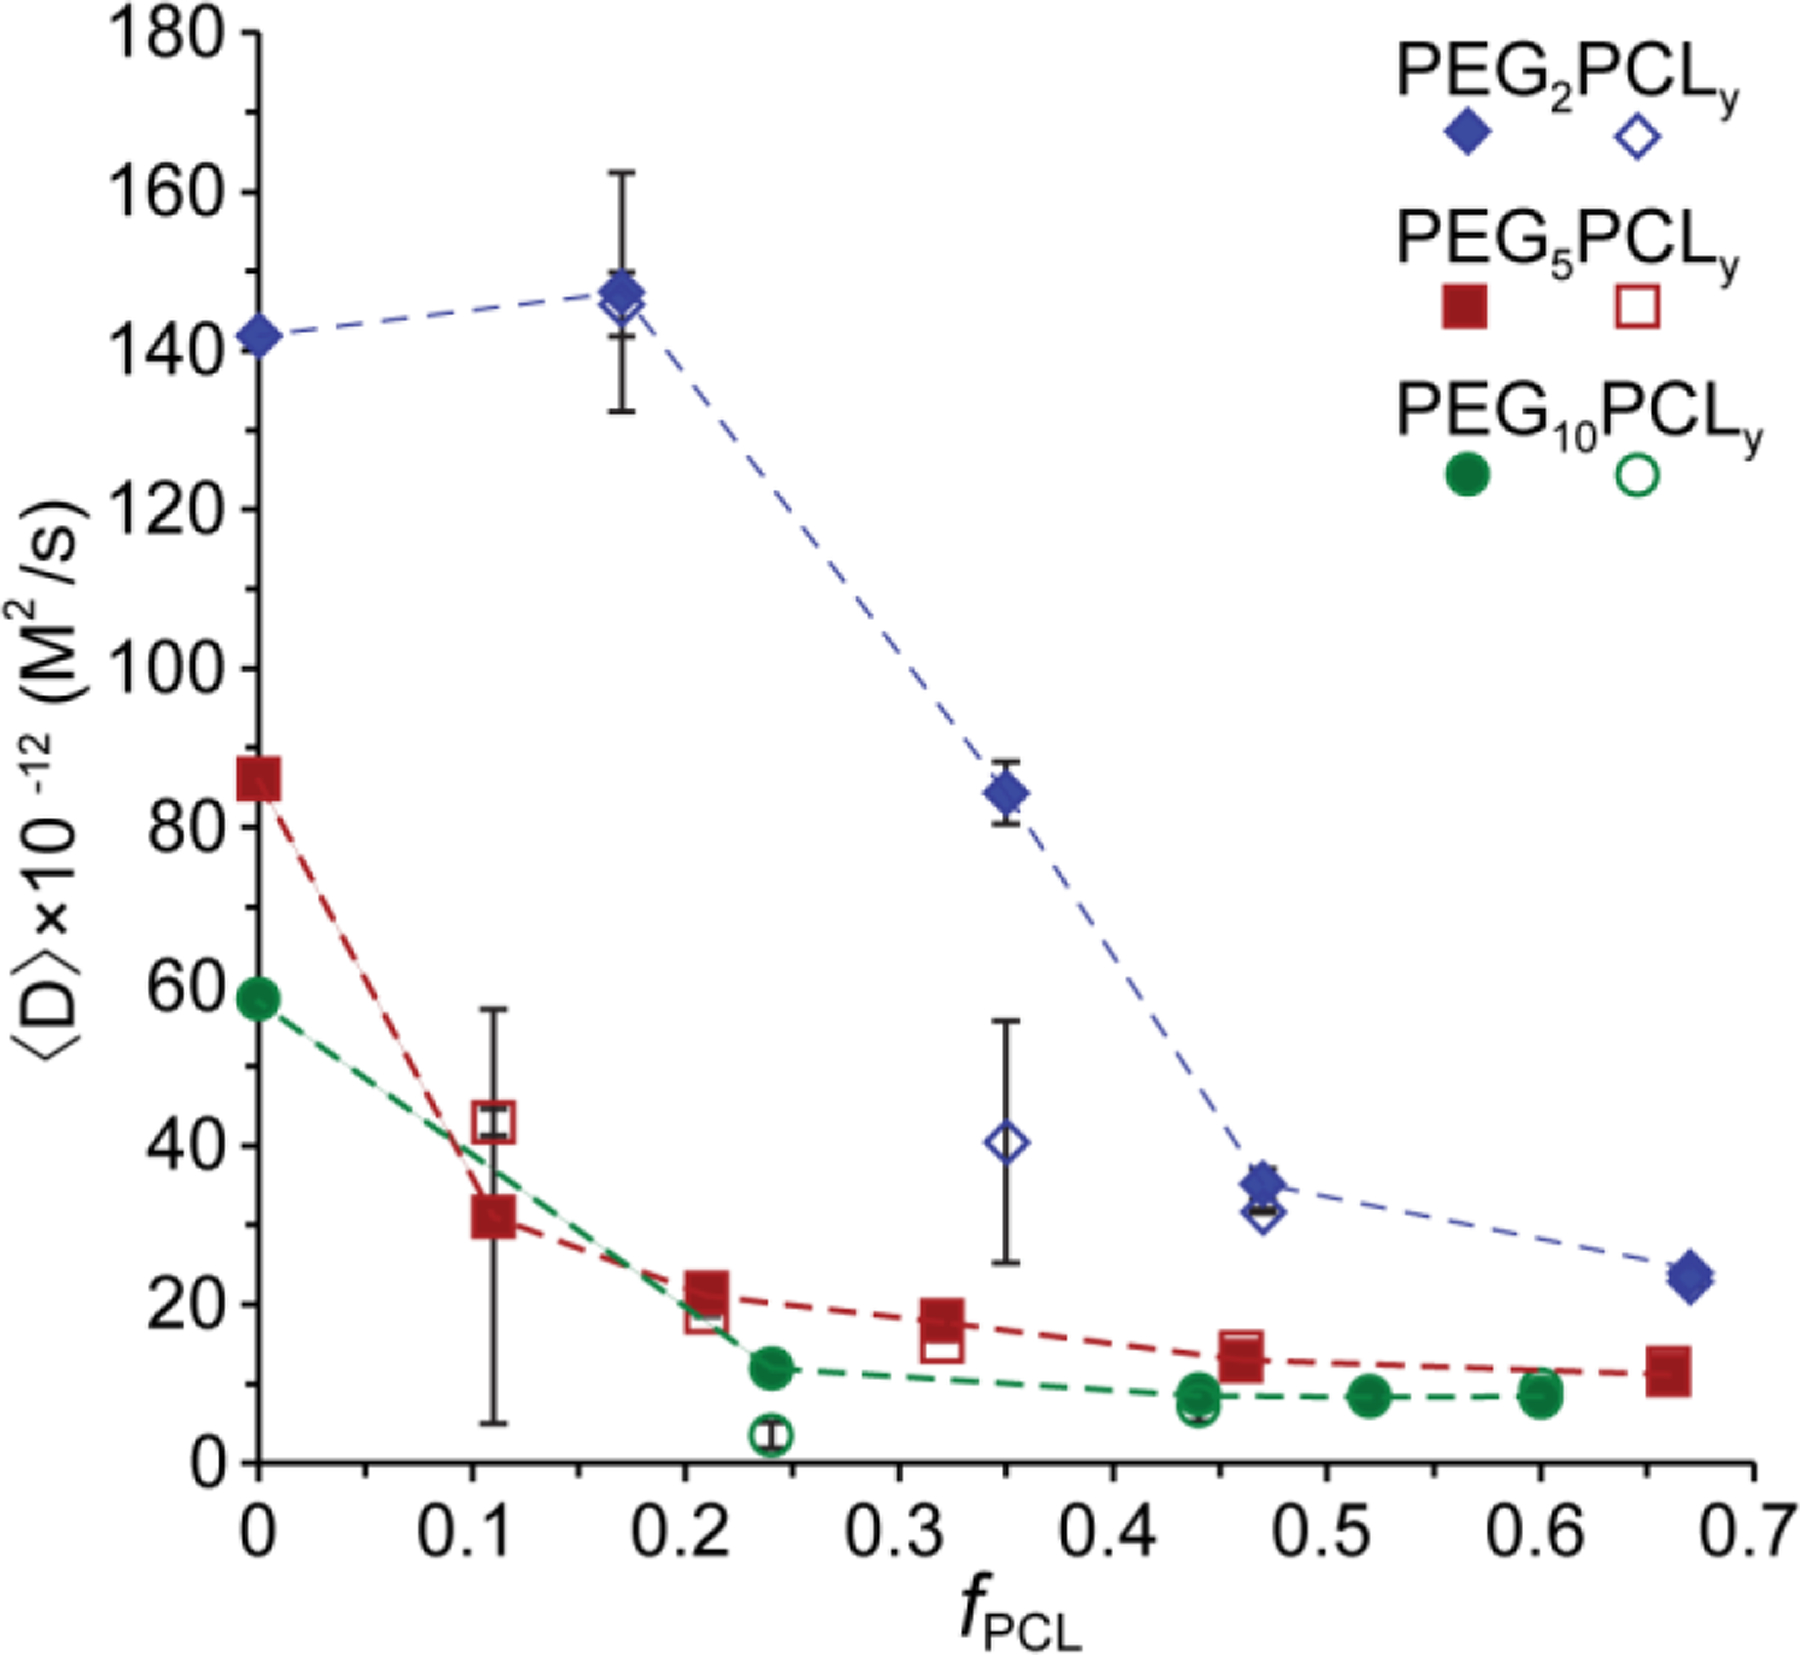
Figure 4:

Mean (marker) and standard deviation (error bars) of measured on three separate self-assembled samples (independent experiments) for each PEGxPCLy copolymer, plotted against fPCL. In most cases, error bars are smaller than symbols. The solid and open symbols represent the of the PEG and PCL blocks, respectively, for the PEG2PCLy (blue), PEG5PCLy (red) and PEG10PCLy (green) copolymer series. Dashed lines are included as a guide to the eye and join the PEG for each series.
