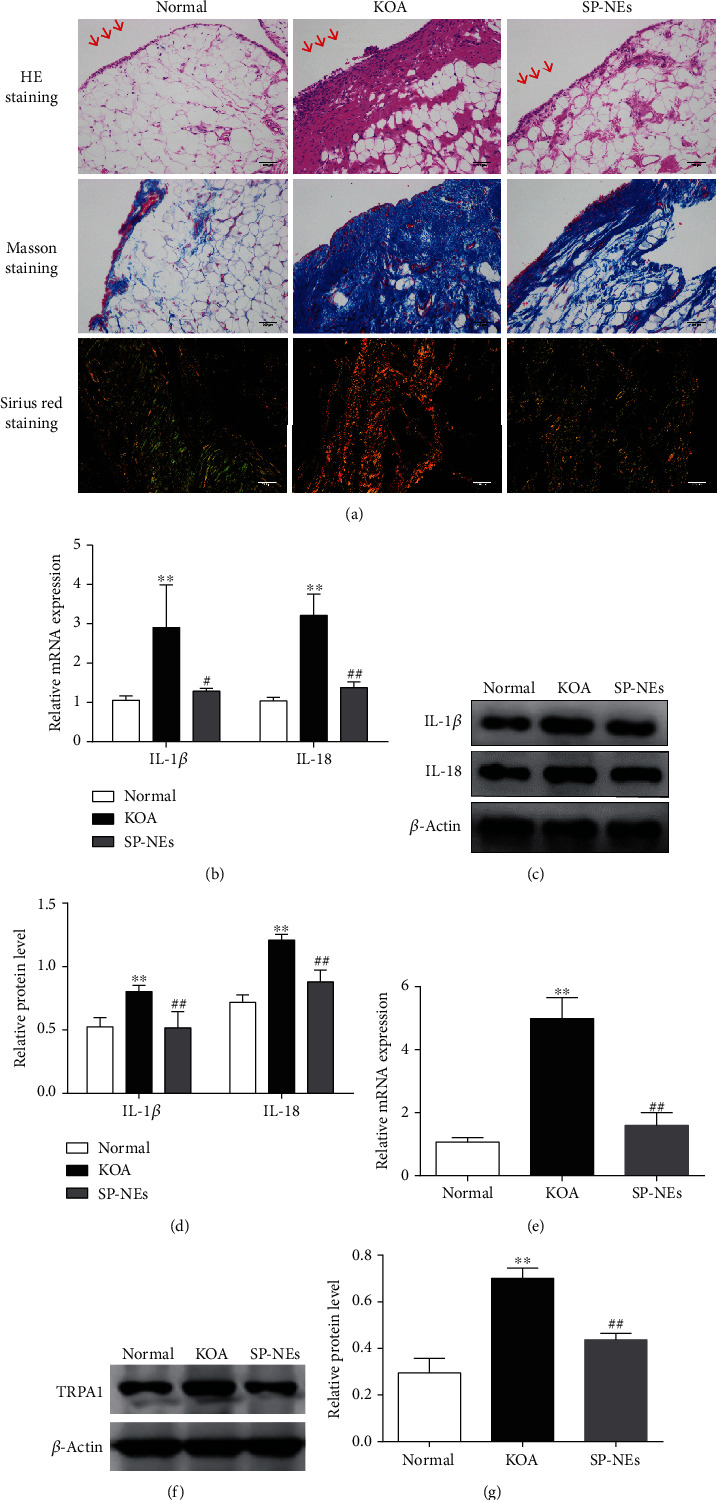
Figure 4.

SP-NEs reduce synovitis and TRPA1 expression in vivo. (a). Representative synovial tissues of each group stained with HE, Masson, and Sirius Red staining, ×200, scale bar = 200 μm. Disorderly arranged synovial lining cells, inflammatory cell infiltration (red arrow on HE staining), and increased collagen deposition (blue area in the Masson staining) especially collagen type I (bright yellow area in Sirius Red staining, and the green area represented collagen type III) could be observed in the KOA group. (b). Relative gene expression of IL-1β and IL-18 in synovial tissues of rats in each group. ∗∗P < 0.01 vs. the normal, #P < 0.05, ##P < 0.01 vs. the KOA. (c). Typical protein bands of IL-1β and IL-18 for each group. (d). Relative protein level of IL-1β and IL-18 in synovial tissues. ∗∗P < 0.01 vs. the normal, ##P < 0.01 vs. the KOA. (e). Relative gene expression of TRPA1 in synovial tissues of rats in each group. ∗∗P < 0.01 vs. the normal, ##P < 0.01 vs. the KOA. (f). Typical protein bands of TRPA1 (g). Relative protein level of TRPA1 in synovial tissues. ∗∗P < 0.01 vs. the normal, ##P < 0.01 vs. the KOA.
