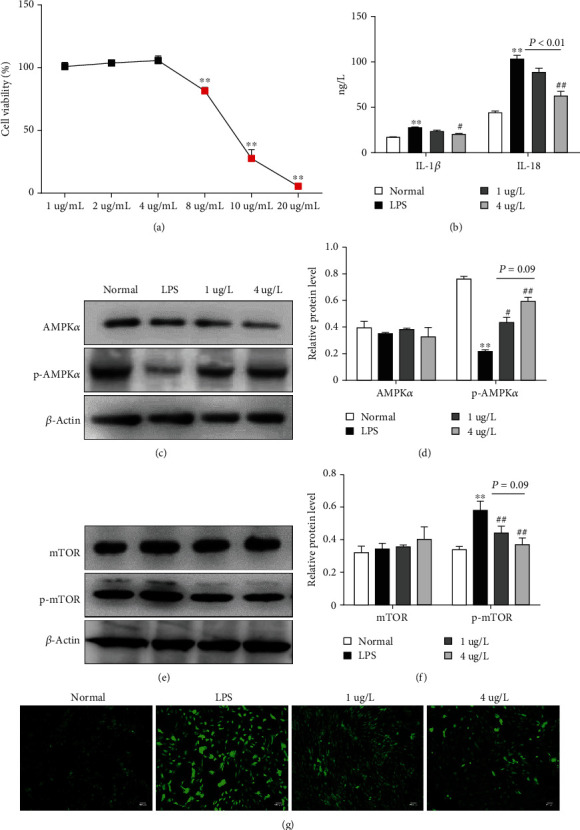
Figure 6.

SP-NEs modulate AMPK-mTOR activity in LPS-stimulated FLSs. (a) Different concentrations of SP-NEs on cell viability. (b).The contents of IL-1β and IL-18 in the supernatant of FLSs in each group. (c). Typical protein bands of AMPKα and p-AMPKα, in FLSs for each group. (d) Relative protein level of AMPKα and p-AMPKα for each group. ∗∗P < 0.01 vs. the normal, #P < 0.05 vs. the KOA, ##P < 0.01 vs. the KOA, P = 0.09, comparison between the underlined two groups. (e) Typical protein bands of mTOR and p-mTOR in FLSs for each group. (f) Relative protein level of mTOR and p-mTOR in each group. ∗∗P < 0.01 vs. the normal, ##P < 0.01 vs. the KOA, P = 0.09, comparison between the underlined two groups. (g) DCFH-DA probe labeled ROS to reflect mitochondrial function and green fluorescence intensity indicated ROS level.
