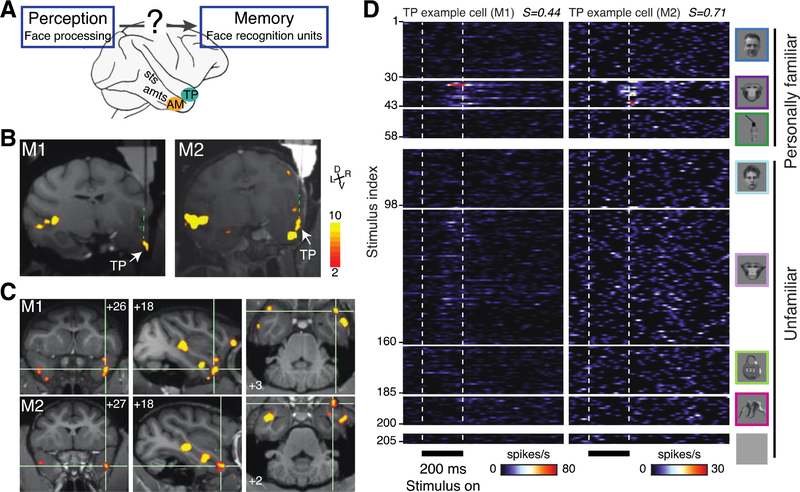
Fig. 1: Cells in the temporal pole area TP respond to familiar faces.
(A) Schematic: face perception systems are thought to feed into downstream face memory systems (3) in ways yet unknown. Candidate areas in the macaque brain are area AM and area TP (B) Structural MRI (T1) and functional overlay (faces>objects, color coded for negative common logarithm of p value (p<0.001, uncorrected) showing electrodes targeting recording TP in monkeys M1 and M2 (see Methods). (C) Coronal (left), parasagittal (middle) and axial (right) slices showing TP in M1 and M2. Numbers indicate stereotaxic coordinates: mm rostral to interaural line, mm from midline to the right, and mm dorsal from interaural line, respectively. (D) Mean peri-stimulus time histograms of two TP example cells (left M1, right M2) responding to 205 stimuli set (Face Object Familiarity, FOF) in eight categories (top to bottom, far right) presented for 200ms (bottom) with 500ms inter-stimulus intervals in spikes per second (color scale bottom). Each cell responds significantly to a range of familiar monkey faces. Sparseness indexes (see Methods) are shown in the top right of each plot.

