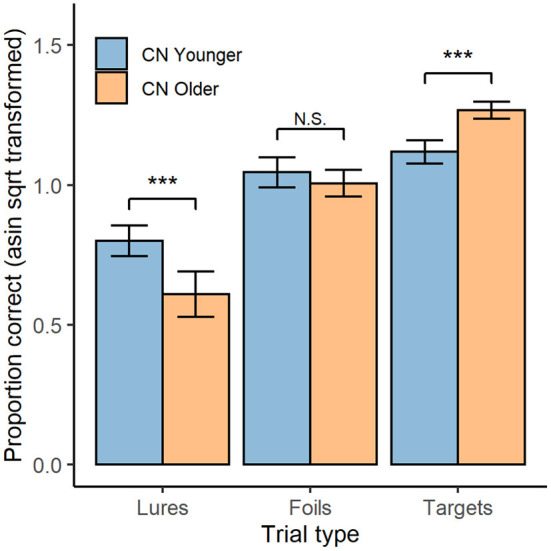
Figure 2.

OCL Performance by trial type and age group. Mean performance on both the OCL48 and OCL80 for each trial type (lures, foils, and targets; x-axis), for both younger (blue) and older (orange) groups. Error bars represent 95% confidence intervals. Asin sqrt, arcsine square root N.S., non-significant. ***p < 0.001.
