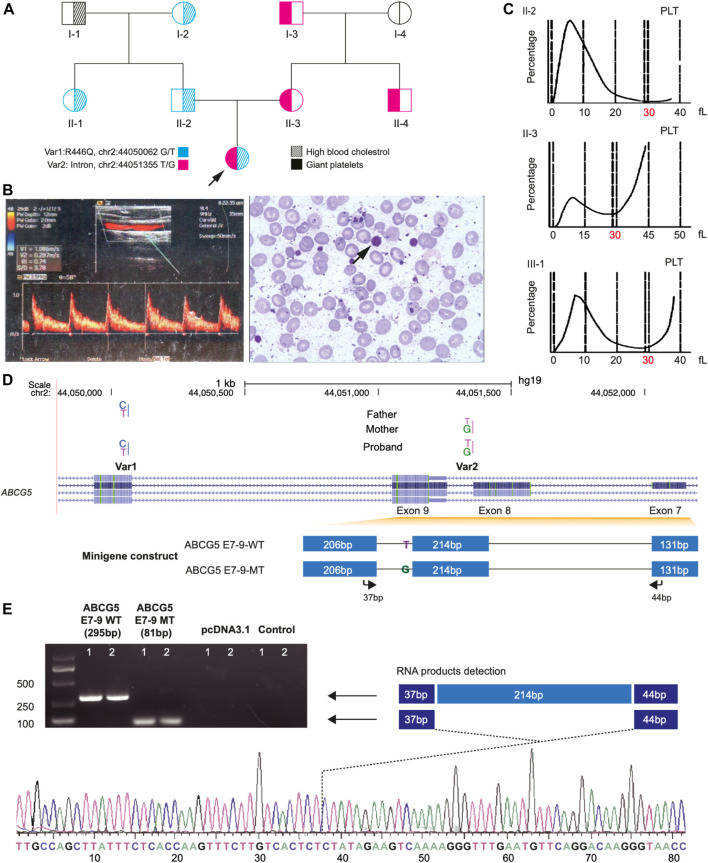
FIGURE 1.
Clinical Phenotypes and Identification of Two Novel Mutations of ABCG5 Gene of the proband in a pedigree family. Panel (A) shows the large platelet in the blood smear (left) and the atherosclerotic plaque by B-mode ultrasound measurement from the proband. Panel (B), a pedigree chart shows the phenotype distribution in all family members and the transmission of two novel variants (Var 1 and Var 2) of ABCG5 in the family. Panel (C) shows the size distribution of platelets (PLT) in the proband and her parents. The dash lines represent the platelets’ volume, and the double dash lines indicate 30 fl, in which 40 fl is the up limitation for the normal distribution of PLT. Panel (D) shows the ABCG5 gene model from the NCBI database and the inserted fragments in the constructs for wild type and Var2 mutant in the splicing pattern assay. The arrows indicate the primer pairs used for the detection of the mRNA products which were transcribed from the constructs. Panel (E) shows the PCR amplification results of two products generated from wild-type and Var2 mutant constructs, respectively. The product from the wild-type construct is 295 bp, and the product for the mutant is 81 bp due to deleting exon 8 of the ABCG5 gene. The truncated transcripts were further verified by Sanger sequencing.

