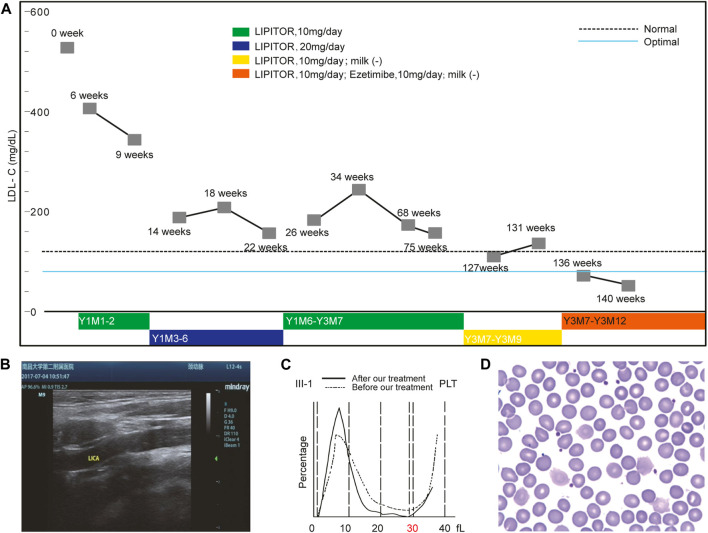
FIGURE 2.
Ezetimibe Corrected the Phenotypes of the Proband. Panel (A) shows the changes in the LDL-C levels under an optimized treatment regimen. Panel (B) shows the disappearance of the aforementioned atherosclerotic plaque revealed by the ultrasound scan after Ezetimibe treatment. Panel (C) shows the comparison of platelet size distributions before and after Ezetimibe treatment in the proband. Panel (D) shows the disappearance of the large platelet in the blood smear of the proband after treatment of Ezetimibe.

