Table 1.
Relationship between biochemical variables (outcome) and CGG repeats, separately for FXTAS and Non-FXTAS assessed by robust regression.
| FXTAS | Non-FXTAS | |||||||
|---|---|---|---|---|---|---|---|---|
| N | Coef | se | p * | N | Coef | se | p* | |
| Relative AMPK activity+ | 19 | 1.85 | 0.96 | 0.054 | 28 | 0.30 | 0.33 | 0.364 |
| TORC1 activity+ | 16 | 0.10 | 0.14 | 0.459 | 17 | 0.17 | 0.33 | 0.616 |
| Mitochondrial mass+ | 10 | −0.27 | 0.09 | 0.004* | 15 | 0.10 | 0.03 | 0.001* |
| ROS+ | 10 | 0.26 | 0.82 | 0.753 | 15 | −0.41 | 0.10 | <0.001* |
| Basal respiration rate | 17 | 3.00 | 1.72 | 0.081 | 26 | −1.69 | 0.65 | 0.009 |
| ATP Synthesis | 17 | 1.32 | 1.36 | 0.332 | 26 | −1.15 | 0.49 | 0.019 |
| Non-mitochondrial ATP OCR | 17 | 0.99 | 0.23 | <0.001* | 26 | −0.28 | 0.20 | 0.169 |
| Proton Leak OCR | 17 | 0.46 | 0.36 | 0.195 | 26 | −0.34 | 0.20 | 0.077 |
| ATP steady state level+ | 18 | 0.84 | 1.01 | 0.409 | 27 | −0.88 | 0.33 | 0.008 |

|
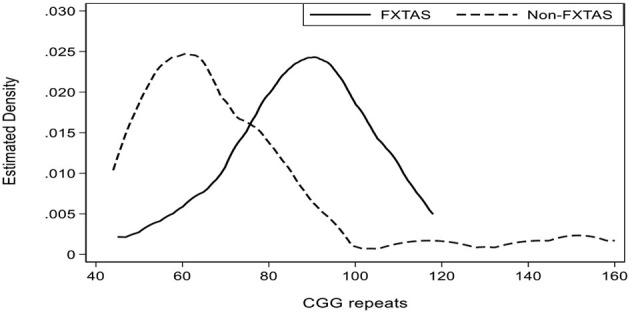
Kernel density estimate of distribution of CGG repeat numbers for FXTAS and non-FXTAS subgroups separately. | |||||||
Analyses were conducted using robust linear regression; N, sample size; p, p-value; +Estimated regression coefficient (Coef) and standard error (se) were multiplied by 100;
adjusted p-value remained < 0.05 after adjustment for multiple testing using Bonferroni correction method. Bold figures indicate significant relationships prior to adjustment for multiple testing.
