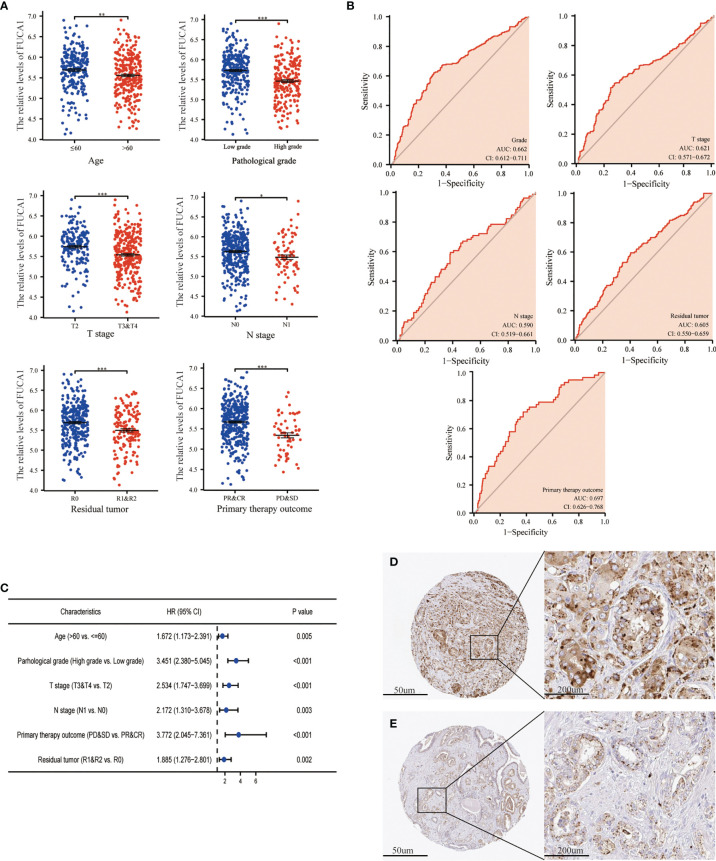
Figure 3.
The expression of FUCA1 in PCa subgroups. (A) FUCA1 mRNA expression in different PCa subgroups. (B) The diagnostic value of FUCA1 for different PCa clinicopathological parameters. (C) Logical regression analysis of clinicopathological variables’ effects on low FUCA1 expression. IHC analysis of FUCA1 in low- (D) and high-grade (E) PCa tissue. CR, complete response; PR, partial response; SD, stable disease; PD, progressive disease. *p < 0.05, **p < 0.01, ***p < 0.01. PCa, prostate cancer; IHC, immunohistochemistry.

