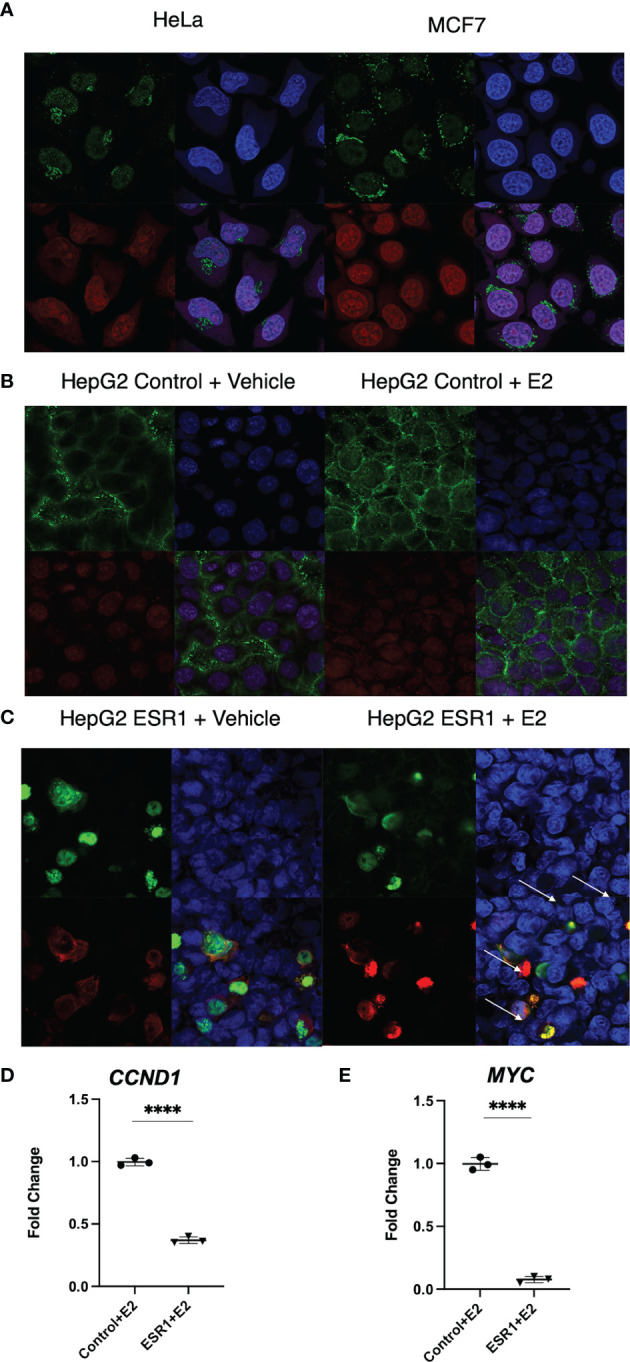
Figure 3.

ER-α colocalization with β-catenin decreases β-catenin target gene expression in vitro. (A) Immunofluorescent analysis of β-catenin (top left panel) and ER-a (bottom left panel) on HeLa and MCF7 cells. Nuclei (top right panel) were stained with DAPI. Merged image (bottom right panel) showing a nuclear localization of ER-a in MCF7 and cytoplasmic localization of β-catenin in both cell lines. The images were captured at 40X magnification. (B) Immunofluorescent analysis of β-catenin (top left panel) and ER-α (bottom left panel) on HepG2 cells transfected with the control vector and exposed to vehicle or E2. Nuclei (top right panel) were stained with DAPI. Merged image (bottom right panel) showing the detection of cytoplasmic localization of β-catenin and absence of ER-α in the nucleus of HepG2 cells. (C) Immunofluorescent analysis of β-catenin (top left panel) and ER-α (bottom left panel) on HepG2 cells transfected with ESR1 coding vector and exposed to vehicle or E2. Nuclei (top right panel) were stained with DAPI. Merged image (bottom right panel) showing the concomitant detection in the nucleus of both β-catenin and ER-α in HepG2 cells represented by the yellow fluorescence as indicated by the white arrows. The images were captured at 40X magnification. (D) HepG2 cells overexpressing ESR1 expressed less CCND1 (FC = 0.3), MYC (FC = 0.065). Mean with SD values from N = 3 independent experiments are represented in the graph. ****p < 0.0001, Student’s t-test. SD, standard deviation.
