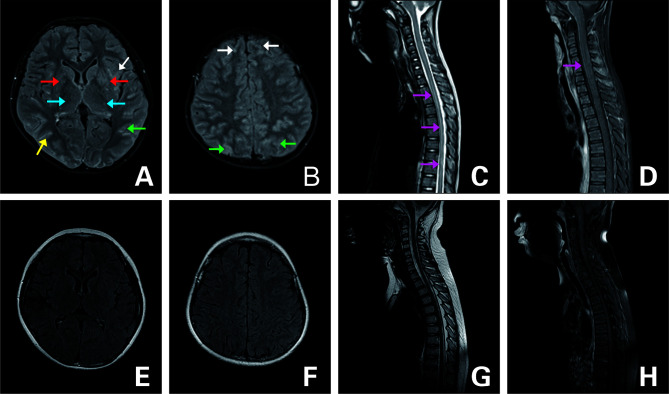
Figure 2.
FLAIR MRI of the brain and spine (A–D) upon admission and (E–H) 3 months later. (A, B) T2-hyperintense lesions in bilateral frontal (white arrow), parietal (green arrow), occipital (yellow arrow) cortex and white matter, basal ganglia (red arrow), thalamus (blue arrow), and diffuse enhancement. (C) Lesion in the T1-L1 (purple arrow). (D) Strip enhancement of spinal meninges (purple arrow). (E–G) Follow-up images of improved T2 lesions. (H) Follow-up image of the enhancement after it disappeared.

