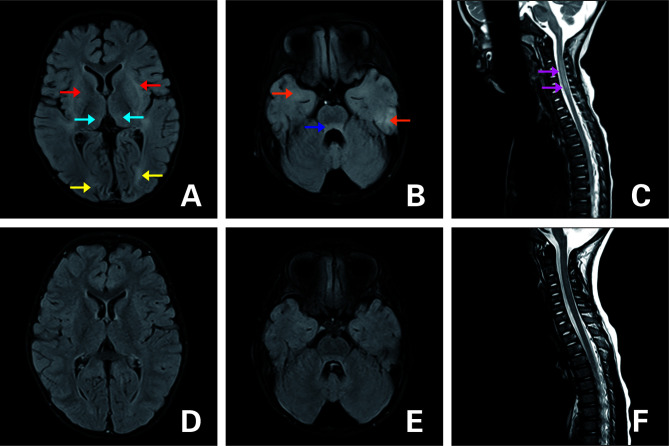
Figure 3.
FLAIR MRI of the brain (A–C) upon admission and (D–F) 3 months later. (A, B) T2-hyperintense lesions in the dorsal thalamus (blue arrow), basal ganglia (red arrow), bilateral cerebral hemispheres (yellow arrow:occipital lobe;orange arrow:temporal lobe), and pontine (dark blue arrow). (C) Lesions in the cervical spinal cord (purple arrow). (D–F) Follow-up images of T2 lesions after they disappeared.

