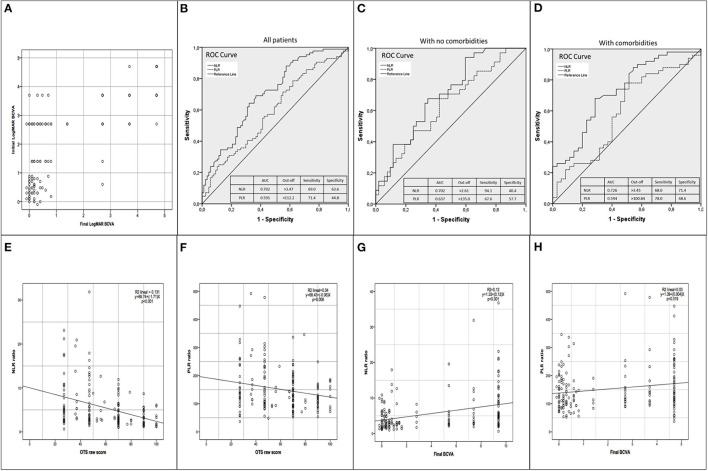
Figure 1.
(A) Scatterplot of the initial LogMAR best corrected visual acuity (BCVA) with the final LogMAR BCVA. Patients with better initial BCVA were more likely to have better final BCVA. The majority that ended with severe visual impairment (SVI) had poor initial BCVA (LogMAR >2.00 equivalent to count fingers or worst). Only 2 patients with initial BCVA better than count fingers ended with SVI. (B) Receiver Operating Characteristics (ROC) curve analysis for discrimination between patients with SVI and Non-SVI (NSVI) in all patients. (C) ROC curve analysis for discrimination between patients with SVI and NSVI only in patients with no comorbidities. (D) ROC curve analysis for discrimination between patients with SVI and NSVI only in patients with comorbidities. (E) Scatterplot and linear regression of neutrophil to lymphocyte ratio (NLR) with the ocular trauma score (OTS) raw points. (F) Scatterplot and linear regression of platelet to lymphocyte ratio (PLR) with the OTS raw points. (G) Scatterplot and linear regression of NLR with the final BCVA. (H) Scatterplot and linear regression of PLR with the final BCVA.

