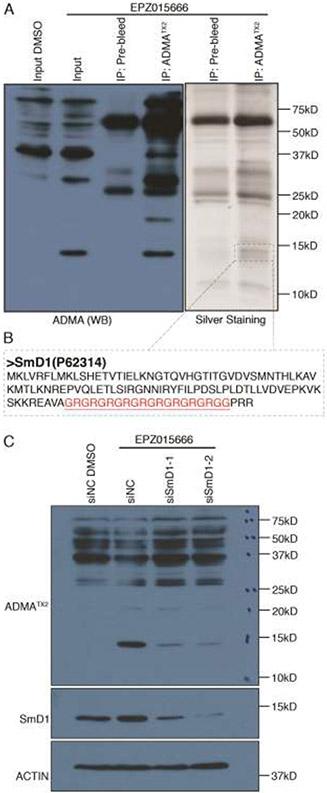
Figure 4.
SmD1 displays increased ADMA levels under EPZ015666 treatment. (A) 293T was treated with 5uM EPZ015666 for 48 hours, whole cell lysates were harvested and subjected to a co-IP assay using ADMATX2 antibody or pre-bleed serum. The samples were analyzed by Western blot and silver staining. The band that specifically occurred in ADMATX2 IP sample silver staining panel was cut out for MS analysis. (B) The sequence of the prime candidate (SmD1) is shown, and the GAR motif is highlighted in red. (C) 293T was transiently transfected with negative control siRNAs(siNC) or siSmD1, and then treated with 5uM EPZ015666 for 48 hours, whole cell lysates were harvested for western blot analysis.

