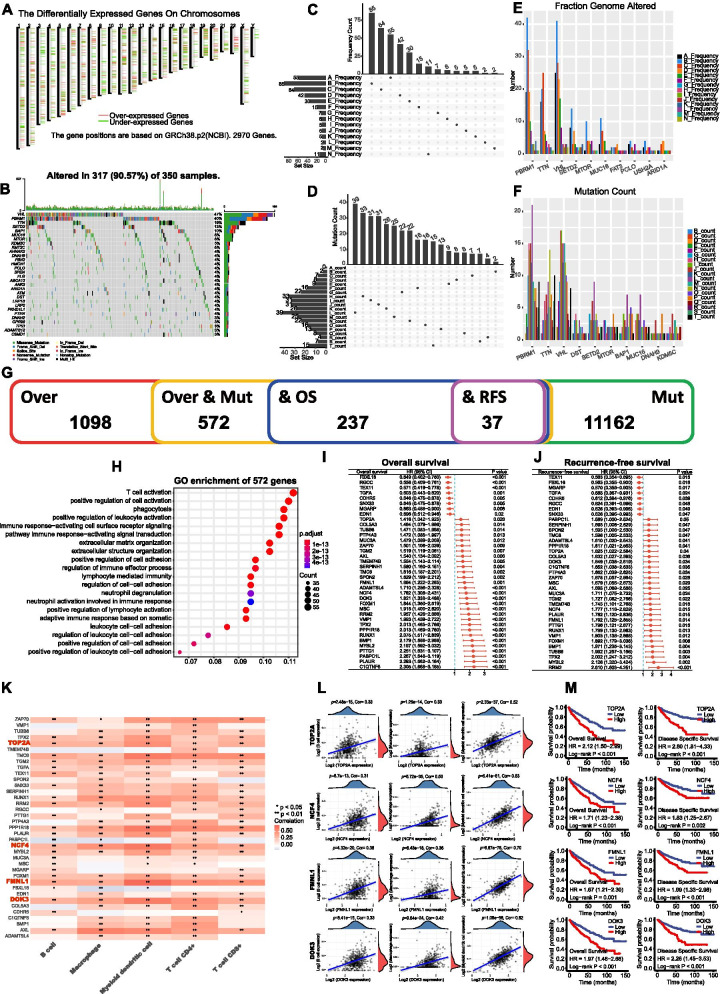
Fig. 1.
Identification of potential antigens in KIRC. a Chromosomal distribution of up- and down-regulated genes in KIRC; b Waterfall diagram of the top 30 mutant genes; c Distribution of mutation frequency; d Distribution of mutation number; e Distribution of mutation number of the top 10 genes; f Distribution of mutation frequency of the top 10 genes. g Overlapped genes identified through intersection; h GO enrichment analysis of 572 genes after intersection of overexpressed and mutated genes; i-j Univariate Cox regression analysis of the 37 potential antigens for OS (i) and RFS (j). k Correlation analysis of 37 genes with immune infiltrating cells, red box indicates genes closely related to APCs (threshold: spearman correlation coefficient > 0.3); l Association of TOP2A, MCF4, FMNL1 and DOK3 with B cell, macrophage, and dendritic cells; m Kaplan-Meier curves of the association of TOP2A, MCF4, FMNL1 and DOK3 with OS and DSS. GO, Gene Ontology; KEGG, Kyoto Encyclopedia of Genes and Genomes; OS, overall survival; RFS, recurrence-free survival; DSS, disease specific survival. * p < 0.05 and ** p < 0.01

