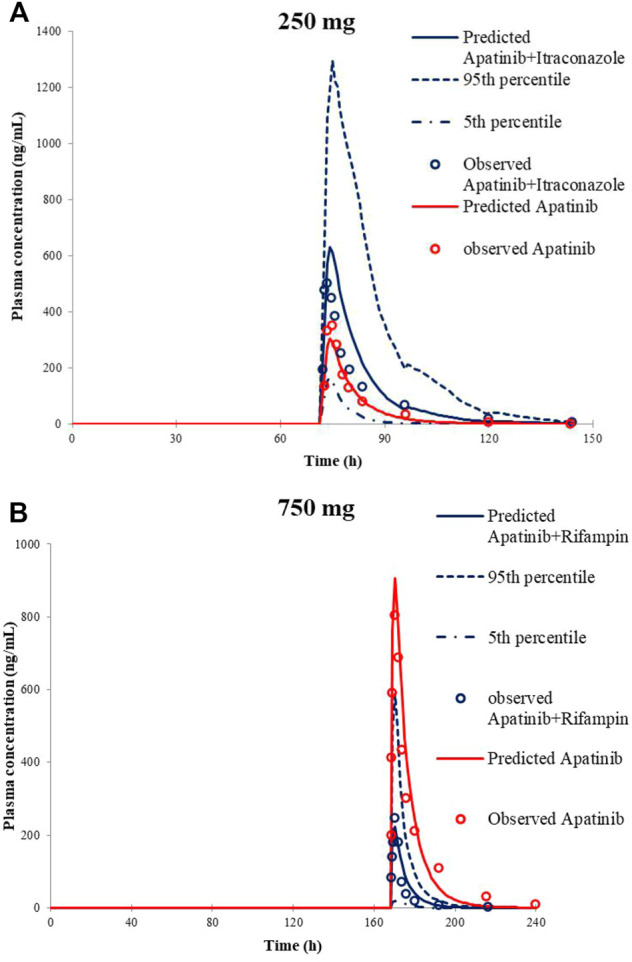
FIGURE 2.

Predicted and observed mean plasma concentration–time curves of apatinib following 250 mg apatinib mesylate tablet in the presence or absence of itraconazole (A) and 750 mg apatinib mesylate tablet in the presence or absence of rifampin (B).
