FIGURE 6.

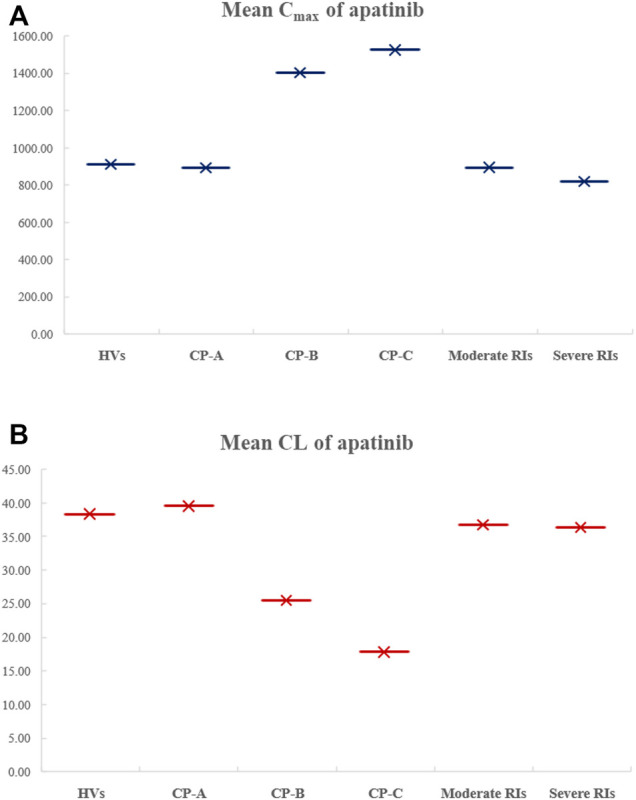
Comparison of the simulated mean Cmax (A) and CL (B) of apatinib in HVs, in HIs with Child–Pugh A, B, or C, as well as in moderate and severe RIs.

Comparison of the simulated mean Cmax (A) and CL (B) of apatinib in HVs, in HIs with Child–Pugh A, B, or C, as well as in moderate and severe RIs.