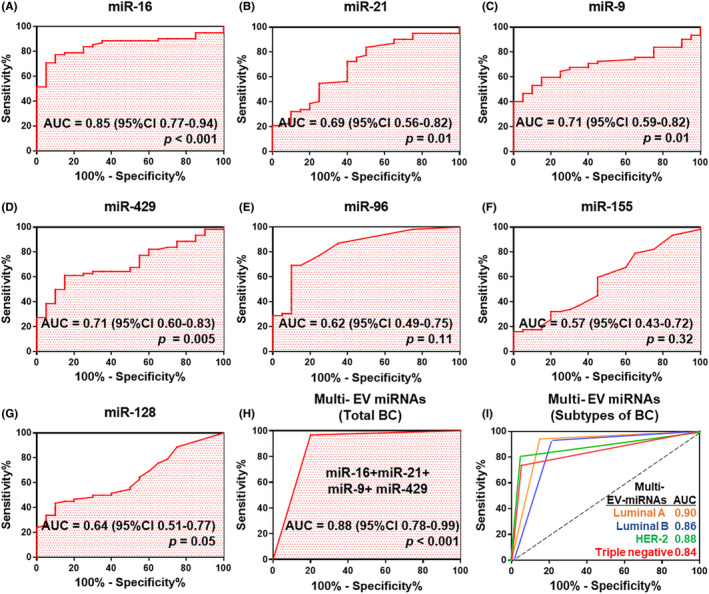
FIGURE 5.

Receiver operating characteristic (ROC) curve analysis of seven candidate miRNAs used to discriminate breast cancer patients from healthy controls. A, Description of Area Under the ROC curve (AUC) value for diagnostic biomarker. B‐G, Potential diagnostic value of miRNA in the extracellular vesicles (EV) from plasma were analyzed by AUC. H, Construction and validation of optimal combination of the top four miRNAs (miR‐16, miR‐21, miR‐429, and miR‐9). I, ROC curve analysis according to the breast cancer subtypes (luminal A, luminal B, HER‐2, and triple negative) using a combination of the top four significant miRNA. miRNA expression was normalized to the average miR‐484 expression in healthy controls using the ΔΔCt method
