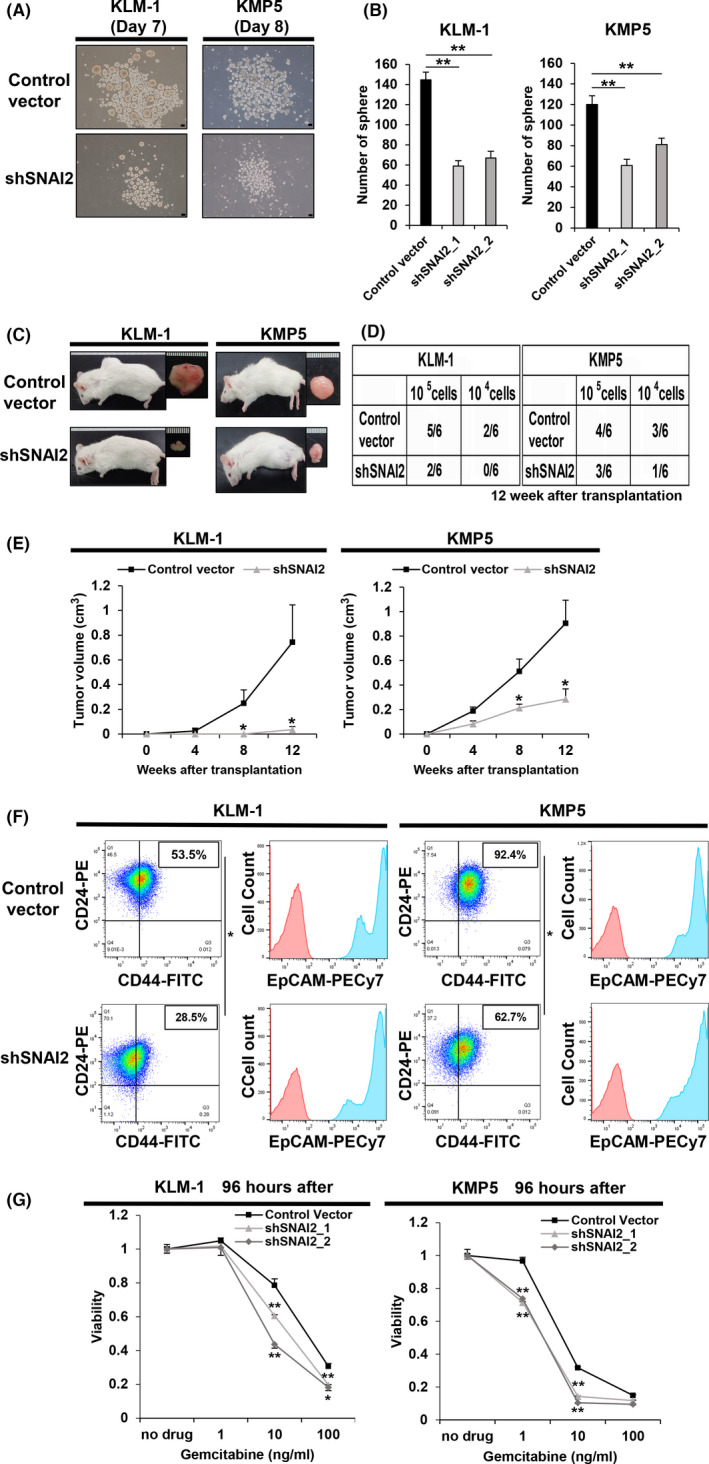
FIGURE 2.

SNAI2 knockdown of tumorigenic pancreatic cancer cell lines reduces tumorigenicity, suppresses CD44 expression, and resistance to gemcitabine. A, B, Sphere formation assay of control vector versus shSNAI2 from KLM1 and KMP5 at days 7 and 8. A, Microscopy images. Scale bars: 100 µm. B, Quantification of the number of spheres. n = 3, each. Mean + SE. **P < .01. C‐E, Control vector and shSNAI2 from KLM1 and KMP5 were subcutaneously transplanted into NOD‐SCID mice (105 cells, 104 cells per site), respectively. n = 6. C, Macroscopic images of formed tumor. shRNA was used shSNAI2_1. D, Number of tumor‐forming mice per total transplanted mice at 12 wk after transplantation. E, Tumor growth curves. Mean + SE. *P < .05. F, Flow cytometric analysis of control vector and shSNAI2 from KLM1 and KMP5. shRNA was used shSNAI2_1. Two parameter plots: CD44‐FITC (X axis), CD24‐PE (Y axis), the numbers in the box represent the CD44‐positive/CD24‐positive cell ratio. Histogram: EpCAM‐PECy7 (X axis), cell count (Y axis). CD44 and CD24 double analysis was performed for the blue colored fraction of the EpCAM panel. n = 2, each. Mean + SE. *P < .05. G, The relative viability of control vector versus shSNAI2 from KLM1 and KMP5 cells 96 h after treating with gemcitabine. Viability curves at 0, 1, 10, 100 ng/mL gemcitabine. n = 3, each. Mean + SE. *P < .05, **P < .01
