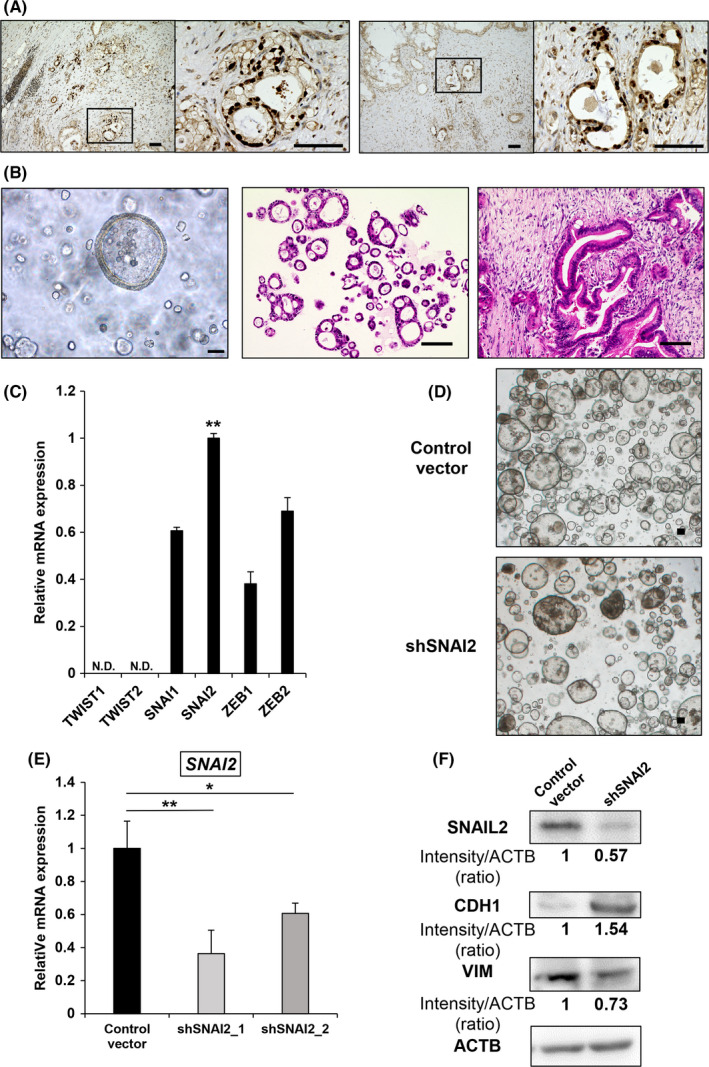
FIGURE 3.

SNAI2 is highly expressed in spheroids established from surgically resected human pancreatic cancer. A, Immunohistochemical SNAIL2 staining of human pancreatic cancer (2 samples). Scale bars: 100 µm. B, Microscope image of spheroids in 3D culture (left), H&E staining of spheroids (middle), H&E staining of primary tumor (right). Scale bars: 100 µm. C, qRT‐PCR (EMT‐TF) of Sphs. Relative expression levels normalized by HPDE cells were compared. n = 3. ND, not detected. Mean + SE. **P < .01. D, Microscopic image of control vector and shSNAI2 from Sphs in 3D culture. Scale bars: 100 µm. E, qRT‐PCR (SNAI2) of control vector versus shSNAI2 from spheroids. n = 3, each. Mean + SE. *P < .05, **P < .01. F, Western blot (SNAIL2, CDH1, VIM, and ACTB) of control vector versus shSNAI2 from Sph. shRNA was used shSNAI2_1. The relative intensity (ratio) is shown below each band
