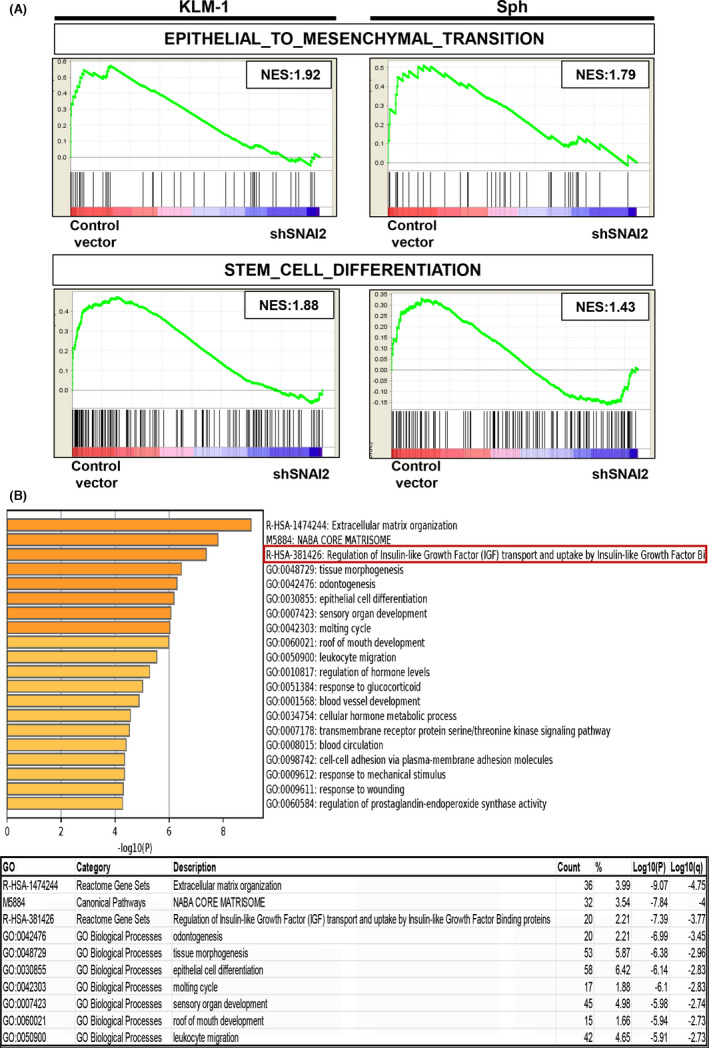
FIGURE 5.

DNA microarray analysis revealed several significant gene sets. A, Gene‐set enrichment analysis plots of the enrichment of the indicated gene signatures in control vector versus shSNAI2 from KLM1 cells and Sphs using the “C5” compilation from Molecular Signature Database (MSigDB, Broad Institute). NES, normalized enrichment score. n = 2, each. B, Gene Ontology enrichment analysis of differentially expressed genes (fold change: 1.5) in control vector versus shSNAI2 common to KLM1 cells and spheroids using the Metascape online tool. Bar graph of top 20 enriched terms across input gene lists (upper), colored by P‐values. Top 10 Gene Ontology list (lower), “Count” is the number of genes in the user‐provided lists with membership in the given ontology term, “%” is the percentage of all of the user‐provided genes that are found in the given ontology term (only input genes with at least one ontology term annotation are included in the calculation), “Log10(P)” is the P‐value in log base 10, “Log10(q)” is the multi‐test adjusted P‐value in log base 10. n = 2, each
