FIGURE 7.

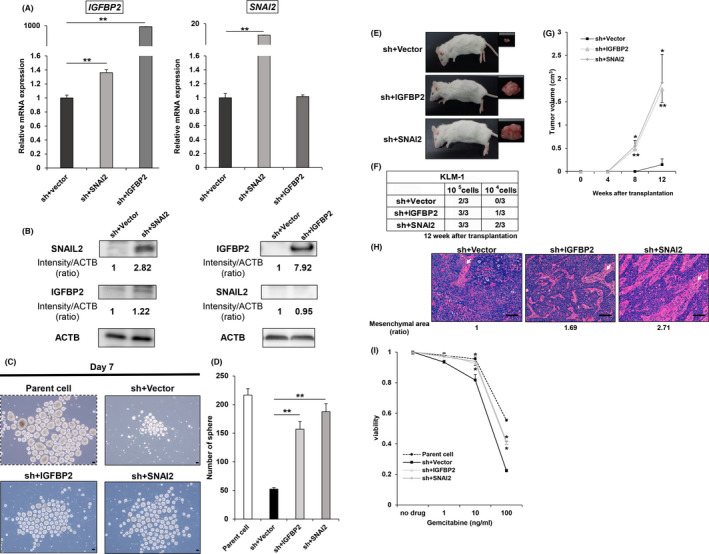
Gene transduction of IGFBP2 and SNAI2 into shSNAI2 restores mRNA and protein expression and improves tumorigenicity and resistance to gemcitabine. A, qRT‐PCR (SNAI2 and IGFBP2) in sh+Vector, sh+IGFBP2 and sh+SNAI2 from KLM1. n = 3, each. Mean + SE. **P < .01. B, Western blot (SNAIL2, IGFBP2, and ACTB) of sh+Vector versus sh+IGFBP2 and sh+SNAI2 from KLM1 cells. The relative intensity (ratio) is shown below each band. C, D, Sphere formation assay of parental cells, sh+Vector, sh+IGFBP2 and sh+SNAI2 from KLM1 cell at day 7. C, Microscope images. Scale bars: 100 µm. D, Quantification of the number of spheres. n = 3, each. Mean + SE. **P < .01. E‐H, sh+Vector, sh+IGFBP2, and sh+SNAI2 cells from KLM1 cells were subcutaneously transplanted into NOD‐SCID mice (105 cells, 104 cells per site), respectively. n = 3. E, Macroscope images of the formed tumor. F, Number of tumor‐forming mice per total transplanted mice at 12 wk after transplantation. G, Tumor growth curves. Mean + SE. *P < .05, **P < .01. H, H&E staining of the formed tumor. The mesenchymal area (indicated by arrows) ratio is shown below each picture. Scale bars: 100 µm. I, The relative viability of parent cells, sh+Vector versus sh+IGFBP2, and sh+SNAI2 from KLM1 cells 96 h after treatment with gemcitabine. Viability curves at 0, 1, 10, 100 ng/mL gemcitabine. n = 4, each. Mean + SE. **P < .01
