Abstract
Immune cells harboring somatic mutations reportedly infiltrate cancer tissues in patients with solid cancers and accompanying clonal hematopoiesis. Loss‐of‐function TET2 mutations are frequently observed in clonal hematopoiesis in solid cancers. Here, using a mouse lung cancer model, we evaluated the activity of Tet2‐deficient immune cells in tumor tissues. Myeloid‐specific Tet2 deficiency enhanced tumor growth in mice relative to that seen in controls. Single‐cell sequencing analysis of immune cells infiltrating tumors showed relatively high expression of S100a8/S100a9 in Tet2‐deficient myeloid subclusters. In turn, treatment with S100a8/S100a9 promoted Vegfa production by cancer cells, leading to a marked increase in the tumor vasculature in Tet2‐deficient mice relative to controls. Finally, treatment of Tet2‐deficient mice with an antibody against Emmprin, a known S100a8/S100a9 receptor, suppressed tumor growth. These data suggest that immune cells derived from TET2‐mutated clonal hematopoiesis exacerbate lung cancer progression by promoting tumor angiogenesis and may provide a novel therapeutic target for lung cancer patients with TET2‐mutated clonal hematopoiesis.
Keywords: angiogenesis, Emmprin, immune cells, lung cancer, S100a8, S100a9, Tet2, Vegfa
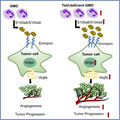
Our study suggests that immune cells derived from TET2‐mutated clonal hematopoiesis exacerbate lung cancer progression by promoting tumor angiogenesis. We present evidence that signaling through the S100a8/S100a9‐Emmprin‐Vegfa axis is essential for progression of a lung cancer model established in a microenvironment of Tet2‐deficient immune cells. Furthermore, we provide a novel target for lung cancer patients with accompanying TET2‐mutated clonal hematopoiesis.
1. INTRODUCTION
Microenvironmental cells promote cancer progression by either directly supporting tumor growth or suppressing an anti–cancer immune response. 1 Immune cells, including myeloid‐derived suppressor cells (MDSC) and tumor‐associated macrophages (TAM), are critical components of the cancer microenvironment. Both are derived from hematopoietic stem/progenitor cells in bone marrow, some of which undergo differentiation in the spleen and finally migrate to and infiltrate cancer tissues.
In aging, however, the hematopoietic system can also undergo gradual replacement via “clonal hematopoiesis,” in which hematopoietic stem/progenitor cells (HSC/HSPC) acquire somatic mutations, clonally expand, and continuously differentiate into various lineages of blood cells harboring those mutations. 2 , 3 In healthy individuals, the frequency of clonal hematopoiesis gradually increases with age and is reportedly approximately 10% in the 60s, 20% in the 70s and 30% in the 80s. 2 , 3 In contrast, the frequency of clonal hematopoiesis was reported to be as high as 25% in patients with solid cancers in a study including more than 8000 patients with various types of solid cancers, such as lung, urogenital, and gastro‐intestinal cancers. 4 , 5 Furthermore, mutations in genes functioning in epigenetic pathways (DNMT3A, TET2, and ASXL1) and in the TP53 pathway (PPM1D and TP53) account for up to 50% of clonal hematopoiesis in patients with solid cancers. 4 Thus, a proportion of immune cells in the cancer microenvironment presumably have somatic mutations identical to those in clonal hematopoiesis. 6 Several studies have reported activities of these immune cells using mouse models: for example, it was shown that melanoma progression is suppressed in a myeloid‐specific Tet2‐deficient model due to increased T‐cell recruitment, 7 while liver cancer progression was enhanced in a systemic Tet2‐deficient model due to expansion of granulocytic MDSC (G‐MDSC) and decreased T‐cell recruitment. 8 Nonetheless, in most types of cancers, it remains unclear how immune cells with somatic mutations function in cancer progression.
In this study, using mouse models, we examined the roles of Tet2‐deficient immune cells in lung cancer. By performing transcriptomic analyses of immune cells and lung cancer cells sorted from Tet2−/− and wild‐type (WT) tumors, we identified how Tet2‐deficient immune cells promote tumor progression. Finally, we established a treatment model based on the molecular mechanisms. These data suggest a novel target for lung cancer patients with TET2‐mutated clonal hematopoiesis.
2. MATERIALS AND METHODS
2.1. Mice
Tet2flox/flox mice 9 were crossed with Mx‐Cre mice 10 to generate Mx‐Cre × Tet2flox/flox mice. These mice are referred to as Tet2−/− and Tet2+/+ mice, respectively. Tet2flox/flox mice were also crossed with LysM‐Cre mice (Strain #004781), purchased from Jackson Laboratory to obtain Tet2flox/flox × LysM‐Cre (Tet2mye−/− ) mice, which show Tet2 disruption specifically in myeloid cells. Tet2flox/flox mice (Tet2mye+/+ ) were used as control. This research was approved by the Facility Review Committee of the Laboratory Animal Resource Center, University of Tsukuba (permission number: 21‐005). All mouse experiments were performed according to guidelines of the Laboratory Animal Resources Center.
2.2. Lung cancer cell lines
Lewis lung carcinoma (LLC) cells purchased from RIKEN BRC were cultured in Dulbecco’s Modified Eagle’s Medium High Glucose (Sigma‐Aldrich, code# D5796) supplemented with 10% fetal calf serum (Bioser, code# 554‐02155) and 1% Penicillin‐Streptomycin Solution (PS; Wako, code# 168‐23191).
2.3. Subcutaneous transplantation of Lewis lung carcinoma cells into the flank of mice
A total of 2 × 10⁵ LLC cells in 100 μL of PBS (Nissui, code# 5913) were subcutaneously injected into flanks of Tet2−/− and Tet2+/+ mice or Tet2mye−/− and Tet2mye+/+ mice. Tumor volume was measured every 2 days after injection with calipers and calculated as length × width × width × 0.52.
2.4. Flow cytometric analysis
A total of 2 × 10⁵ cells recovered from tumors were stained with antibodies for 30 minutes at 4°C in the dark. Flow cytometric data were analyzed using FlowJo software (Tree Star).
2.5. Whole transcriptome analysis
Cd11b+Ly6g+Ly6c− granulocytic myeloid‐derived cells (GMD), Cd11b+Ly6g−Ly6c+ monocytic myeloid‐derived cells (MMD), and Cd11b+Gr1−F4/80+ TAM were sorted from single cell suspensions prepared from tumors in Tet2+/+ or Tet2−/− mice. cDNA libraries were generated from total RNA using a SMARTer Stranded Total RNA‐Seq Kit v2‐Pico Input Mammalian (Takara Bio USA, code# 634412) and sequenced on a HiSeq X system (Illumina) with a standard 150‐bp paired end read protocol. LLC cells (the Cd45−Cd44+Cd113− population) were also sorted from single‐cell suspensions, described above, and similarly subjected to whole transcriptome analysis (WTA).
2.6. Single‐cell RNA sequencing
Cd45+ immune cells were sorted from 1 × 10⁷ cells prepared from tumors from Tet2+/+ or Tet2−/− mice. Cells were then used to establish barcoded single‐cell RNA sequencing (scRNA‐seq) libraries using Chromium Single Cell 3′ Reagent Kits (V2) (10X Genomics) according to the manufacturer’s instructions (CG000183 Rev A), targeting 4000 cells per library. Libraries were sequenced on a HiSeq X system (Illumina) with a depth of 50 450 reads per cell for Tet2+/+ and 82 634 for Tet2−/− .
2.7. Mouse antibody treatment
A total of 2 × 10⁵ LLC cells in 100 µL PBS were subcutaneously injected into the right flank of Tet2−/− or Tet2+/+ mice. Starting at day 8 after injection, an anti–Emmprin antibody (Cd147 monoclonal antibody functional grade; eBioscience, clone RL73, code# 16‐1471‐38) or isotype control (rat IgG2a kappa isotype control functional grade; eBioscience, clone BR2a, code# 16‐4321‐85) was administered intraperitoneally at 10 μg in 100 µL PBS per mouse every 2 days with 4 doses in total. Mice were analyzed at day 16.
2.8. Statistical analyses
Results are shown as mean ± SD. A two‐tailed Student’s t‐test was calculated to compare two groups. Two‐way ANOVA was used for four groups of Emmprin antibody treatment experiments. A P value <.05 was considered statistically significant.
3. RESULTS
3.1. Tet2‐deficent myeloid cells promote lung cancer progression
To define the function of TET2‐mutated immune cells in lung cancers, we subcutaneously transplanted LLC cells, which are mouse lung cancer cells, into the back of Mx‐Cre 10 × Tet2 conditional knockout (Tet2−/− ), in which the Tet2 gene is disrupted in all the hematopoietic cells 9 or control (Tet2+/+ ) mice and observed tumor growth by measuring the tumor size every other day (Figure 1A, left panel). Tumor growth was enhanced in Tet2−/− relative to Tet2+/+ mice (Tet2−/− vs Tet2+/+ : day 8, 56.19 ± 39.90 mm3 vs 12.29 ± 18.78 mm3, P = .016; day 14, 467.12 ± 179.58 mm3 vs 127.16 ± 59.08 mm3, P < .001; day 16, 848.01 ± 290.50 mm3 vs 245.17 ± 188.53 mm3, P < .001) (Figure 1A, right panel). Tumor weight and size at day 16 were both higher in Tet2−/− relative to Tet2+/+ mice (Tet2−/− vs Tet2+/+ ; 0.573 ± 0.073 g vs 0.258 ± 0.060 g, P = .002) (Figure 1B, upper panel), and tumors were macroscopically larger (Figure 1B, lower panel).
FIGURE 1.
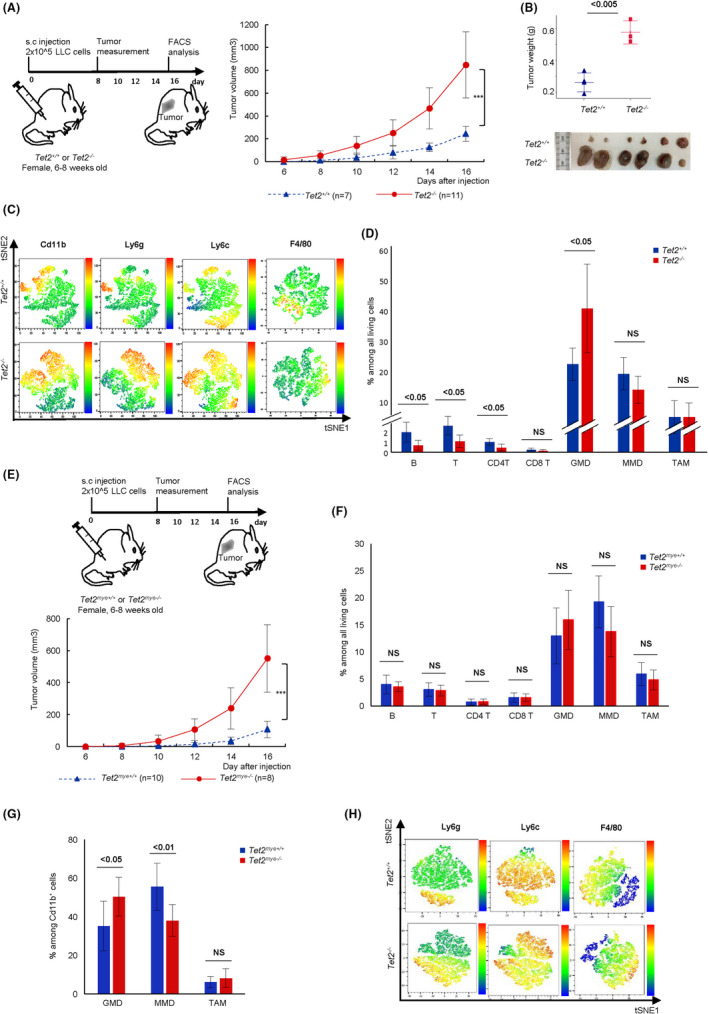
Tet2‐deficient immune cells promote lung cancer progression in mice. A, Experimental schema (top). Tumor volume from day 8 (bottom). Tet2+/+ , n = 7; Tet2−/− , n = 11. B, Weight (top) and macroscopic analysis (bottom) of tumors at day 16 after Lewis lung carcinoma (LLC) injection. Tet2+/+ , n = 4; Tet2−/− , n = 3 (top); Tet2+/+ , n = 6; Tet2−/− n = 6 (bottom). C, Representative tSNE heatmaps of flow cytometric data of tumors of Tet2+/+ and Tet2−/− mice. D, The proportion of indicated immune cell subsets in tumors. Tet2+/+ , n = 7; Tet2−/− , n = 7. E, Experimental schema (top). Tumor volume. Tet2mye+/+ , n = 10; Tet2mye−/− , n = 8 (bottom). F and G, Proportions of indicated immune cell subsets (F) and among CD11b+ subsets (G). Tet2mye+/+ , n = 7; Tet2mye−/− , n = 8. H, Representative tSNE heatmaps of flow cytometric data for Cd11b+ cell fractions. Mean ± SD is shown. For all panels, *P < .05; **P < .01; **P <.005; ns, not significant
Based on flow cytometric analysis, immune cells from tumor tissues in both Tet2−/− and Tet2+/+ mice primarily consisted of CD11b‐positive myeloid cells (Figure 1C and Figure S1A). The proportion of GMD was slightly, but significantly, greater in tumor tissues from Tet2−/− compared to Tet2+/+ mice, while that of MMD and TAM was comparable between genotypes (Tet2−/− vs Tet2+/+ : GMD, 40.32% vs 24.68%, P = .018; MMD, 17.50% vs 22.00%, P = .291; TAM, 9.90% vs 9.86%, P = .964) (Figure 1D).
To further assess the function of Tet2‐deficient myeloid cells in lung cancer development, we then transplanted LLC cells into the back of LysM‐Cre 11 × Tet2 conditional knockout (Tet2mye−/− ), in which the Tet2 gene is disrupted only in myeloid cells or control (Tet2mye+/+ ) mice and observed tumor growth every other day (Figure 1E, upper panel). Tumor growth was again enhanced in Tet2mye−/− relative to Tet2mye+/+ mice (Tet2mye−/− vs Tet2mye+/+ : day 10, 32.59 mm3 vs 4.21 mm3, P = .035; day 14, 238.97 mm3 vs 33.96 mm3, P < .001; day 16, 551.09 mm3 vs 106.61 mm3, P < .001) (Figure 1E, lower panel). These data suggest that Tet2‐deficient myeloid cells in the tumor microenvironment support tumor growth. Although the proportion of immune cells among living cells based on flow cytometric analysis was comparable in tumor tissues from Tet2mye−/− and Tet2mye+/+ mice, the proportion of GMD among CD11b+ subsets was greater in Tet2mye−/− compared to Tet2mye+/+ mice, while MMD were decreased in Tet2mye−/− compared to Tet2mye+/+ mice, and TAM were comparable between these genotypes (Figure 1F‐H and Figure S1B). These data suggest that Tet2‐deficient GMD rather than MMD or TAM may play key roles in the tumor microenvironment.
3.2. Whole transcriptome analysis identifies factors upregulated in Tet2‐deficient myeloid cells that may support Lewis lung carcinoma cell growth
To identify candidate mediators from Tet2‐deficent myeloid cells that support LLC cell growth, we first performed WTA of bulk RNA extracted from GMD, MMD, and TAM sorted from tumors in either Tet2−/− or Tet2+/+ mice. Principal component analysis and unsupervised clustering revealed distinct gene expression patterns in each fraction between genotypes (Figure S2A,B). When we examined differentially expressed genes (DEG) between Tet2‐deficient and WT GMD, MMD and TAM, we observed the greatest changes in GMD, followed by TAM and MMD, revealing 130, 54, and 41 DEGs in each fraction between Tet2‐deficient and WT groups, respectively (Figure 2A).
FIGURE 2.
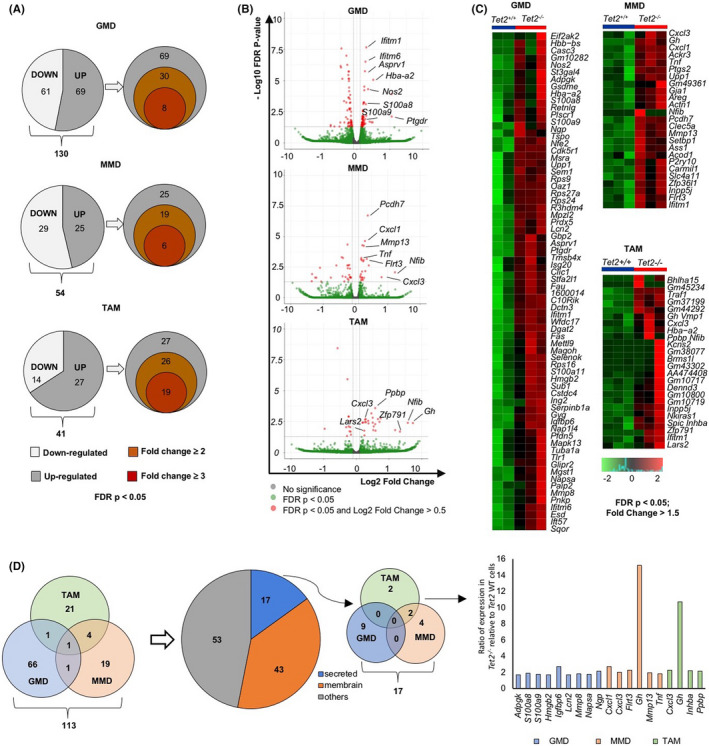
WTA reveals candidate mediators of LLC growth expressed in Tet2‐deficient myeloid cells. A, Pie graphs showing the number of upregulated (grey) or downregulated (white) genes for Tet2‐deficient vs WT GMD, MMD and TAM (left). Venn diagrams show numbers of corresponding upregulated genes (right). B, Volcano plots of DEG. C, Heatmaps of supervised clustering of DEG. D, Venn diagrams of genes upregulated in GMD, MMD. and TAM. DAVID analysis (https://david.ncifcrf.gov/) were used to classify genes encoding secreted proteins (blue), membrane proteins (orange), or others (grey). In the Venn diagram, genes encoding secreted proteins are shown. Bar chart shows gene list and ratio of expression in Tet2‐deficient relative to WT cells
To narrow our search, we identified genes highly expressed in the Tet2‐deficient compared to the WT group (FDR P < .05). Analysis of volcano plots and heatmaps indicated DEG of each fraction upregulated in the Tet2‐deficient compared to the WT group with a fold‐change >1.5 and an FDR P < .05 (Figure 2B,C). We then focused on 17 genes encoding secreted proteins from their GO in DAVID analysis (https://david.ncifcrf.gov/) among a total of 113 genes upregulated in the Tet2‐deficient group (Figure 2D). Nine genes were extracted in the GMD fraction, six in MMD, and four in TAM. In the GMD fraction, S100a8 and S100a9 were highly expressed in the Tet2‐deficient relative to the WT group (Figure 2D).
3.3. Single‐cell transcriptome analysis reveals immune‐cell profiles and identifies candidate mediators that support tumor growth
To comprehensively define the immune‐cell profiles and their transcriptome, we performed scRNA‐seq analysis of Cd45‐positive immune cells sorted from tumor tissues in Tet2−/− and Tet2+/+ mice (Figure S3A). After quality control procedures, we analyzed 4787 and 4000 immune cells from tumor tissues in Tet2−/− and Tet2+/+ mice, respectively, and performed graph‐based clustering to identify cell clusters. Subsequently, each cell cluster was annotated using canonical markers (see Methods). Three major myeloid components (GMD, MMD, and TAM) as well as dendritic cells (DC) and lymphoid B and T cells accounted for 12.45%, 72.23%, 4.01%, 6.61%, 4.38%, and 0.32%, respectively (Figure S3B‐D). scRNA‐seq analysis revealed a higher proportion of GMD among immune cells in tumor tissues from Tet2−/− compared to Tet2+/+ mice, in agreement with flow cytometric data (Figure S3E).
Notably, cell clusters were further subdivided into subclusters by unsupervised clustering: GMD into three (GMD1, GMD2, and GMD3), MMD into five (MMD1, MMD2, MMD3, MMD4, and MMD5), TAM into four (TAM1, TAM2, TAM3, and TAM4), and DC into two (DC1 and DC2) (Figure 3A, upper panel). Among all subclusters, the proportions of GMD1, GMD3, TAM3, and TAM4 were markedly higher in tumors from Tet2−/− relative to Tet2+/+ mice (Figure 3A, lower panel).
FIGURE 3.
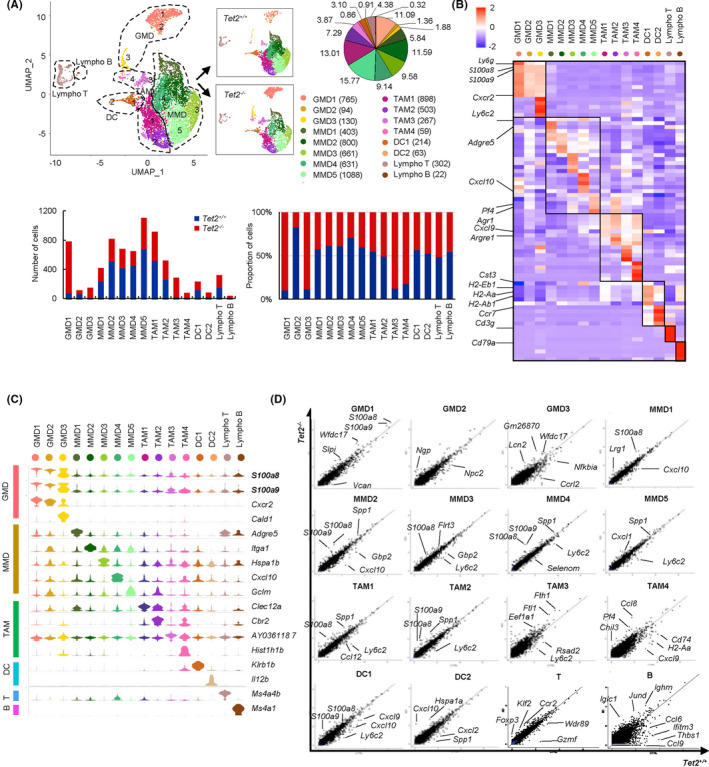
Single‐cell transcriptome analysis reveals comprehensive immune‐cell profiles and identifies candidate growth mediators in Tet2‐deficient GMD. A, A UMAP plot (Tet2−/− vs Tet2+/+ , n = 4787 vs n = 4000) (top left). Pie graph shows proportion of cells in each cluster (top right). Bar charts (bottom) indicate cell numbers (left) and proportions (right) in each cluster. B, Heatmap of the top five conserved markers. C, Stacked violin plots of conserved markers. D, Scatter plots showing DEG
Table S1 lists the top five conserved markers for each subcluster. Notably, S100a8 and S100a9 were highly expressed in all GMD subclusters, although their levels were highest in GMD1 (Figure 3B,C). MMD1, MMD2, MMD3, MMD4, and MMD5 were characterized by high expression of Adgre5, Itga1, Hspa1b, Cxcl10, and Gclm, respectively (Figure 3C). TAM1 and TAM4 specifically expressed Clec12a and Hist1h1b, respectively, while TAM2 and TAM3 exhibited high expression of Cbr2 and AY0361187, respectively (Figure 3C).
We then performed Metascape analysis to identify enrichment pathways for each subcluster (Table S2). Remarkably, GMD1 cells expressed high levels of genes regulating tumor necrosis factor‐activated receptor activity, secretion of cytokines involved in the immune response, and interleukin (IL)‐1 receptor activity.
We then analyzed DEG for each subcluster between Tet2‐deficient and WT immune cells. We observed the greatest changes in GMD1, followed by TAM1, MMD2, and MMD5 (Figure S4A). Among DEG observed in GMD1, S100a8 and S100a9 were highly expressed in the Tet2‐deficient relative to the WT group (Figure 3D). Intriguingly, many DEG, including S100a8, S100a9, Cd14, and Cxcl10, were shared across various MMD and TAM subclusters, including MMD1, MMD2, MMD3, MMD4, TAM1, and TAM2 (Figure 3D and Figure S4B). Metascape analysis of DEG commonly upregulated in the Tet2‐deficient group in multiple subclusters included leukocyte cell‐cell adhesion, regulation of cytokine production, IL‐17 signaling, and leukocyte migration (Figure S4C). Production of molecular mediators involved in immune and transcriptional dysregulation in cancer was a pathway specifically enriched in GMD1, whereas pathways related to blood vessel endothelial cell migration and response to growth factor and vasculature development were enriched only in MMD and TAM subclusters (Figure S4C).
Finally, we identified 39 genes, encoding secreting proteins, which were upregulated in the Tet2‐deficient group from scRNA‐seq data. In combination with WTA data, we determined 7 genes, namely Ppbp, Igfbp6, S100a8, S100a9, Cxcl1, Flrt3, and Lcn2 (Figure S4D‐G). S100a8 and S100a9 showed the greatest difference in Tet2‐deficient versus WT groups (Figure S4F,G). Thus, in this analysis, we focused on S100a8/S100a9 as candidate mediators.
3.4. S100a8/S100a9 proteins are present at higher levels in plasma of tumor‐bearing Tet2 −/− relative to Tet2+/+ mice
We then sorted GMD from tumors from Tet2+/+ and Tet2−/− mice to assess S100a8 and S100a9 mRNA expression by quantitative PCR (qPCR). Consistently, expression levels of both genes were higher in Tet2‐deficient relative to WT GMD (P < .05) (Figure 4A). We then evaluated S100a8 and S100a9 protein levels in plasma of Tet2−/− and Tet2+/+ mice, with or without tumors. Notably, S100a8 and S100a9 protein levels were higher in the tumor‐bearing group compared with the non‐tumor‐bearing group (P < .005) (Figure 4B). In tumor‐bearing mice, S100a8 and S100a9 protein levels were significantly higher in Tet2−/− relative to Tet2+/+ mice (P < .05), while in non‐tumor‐bearing mice, levels were comparable between both genotypes (Figure 4B). These observations suggest that S100a8/S100a9 secreted from Tet2‐deficient GMD may stimulate LLC growth in Tet2−/− mice.
FIGURE 4.
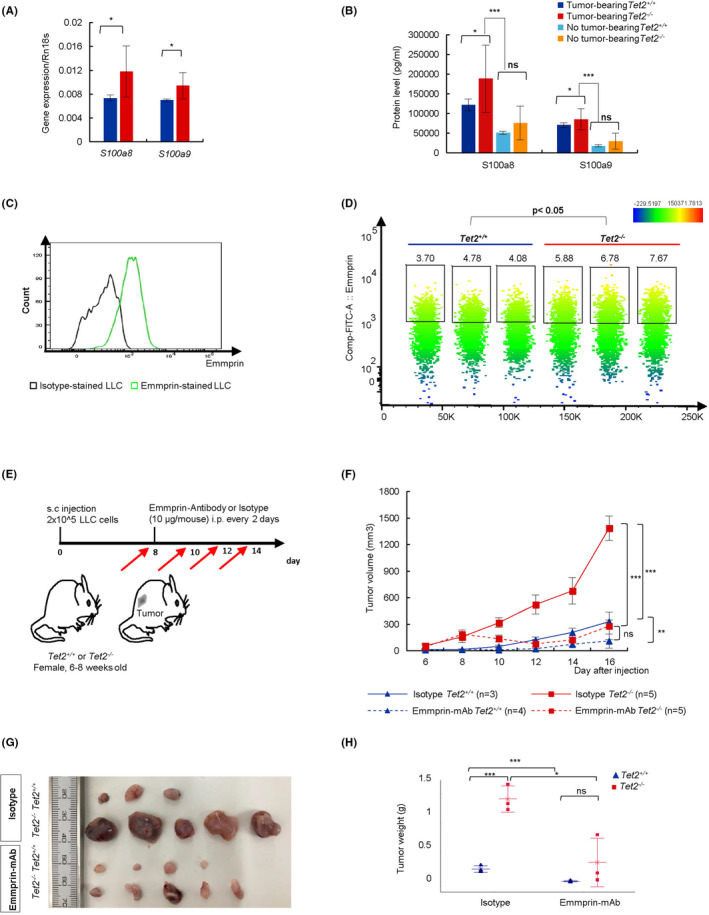
Administration of anti–Emmprin antibody decreases tumor size in Tet2−/− mice. A, Expression of S100a8 or S100a9 transcripts normalized to ribosomal 18s (Rn18s) in GMD Tet2−/− , n = 3; Tet2+/+ n = 4. B, S100a8 and S100a9 protein levels in plasmas. For each group, n = 3. C, Histogram showing Emmprin expression on LLC cells. D, A tSNE plot of flow cytometric data based on Emmprin expression on LLC cells from tumors. Tet2−/− , n = 3; Tet2+/+ , n = 3. E, Experimental schema for anti–Emmprin antibody or isotype control. F, Tumor volumes. Mean ± SD is shown. G and H, Macroscopic analysis (G) and tumor weight (H) of groups shown in (F) at day 16. For all panels, *P < .05; **P < .01; ***P < .005; ns, not significant
3.5. Treatment of Tet2−/− mice with anti–Emmprin antibody decreases tumor size
To further assess S100a8/S100a9 activity in tumor‐bearing Tet2−/− mice, we first assessed the expression of the S100a8/S100a9 receptor on LLC cells. Emmprin (Bsg/Cd147) as well as toll‐like receptor 4 (Tlr4) and the receptor for advanced glycosylation end products (RAGE) (Ager) reportedly serve as S100a8/S00a9 receptors. 12 , 13 Re‐analysis of WTA data from LLC cells 14 revealed high Emmprin expression in LLC cells, while Ager and Tlr4 expression levels were very low (Table S3). We then confirmed Emmprin expression by flow cytometry on LLC cells maintained in vitro as well as those purified from tumors in Tet2−/− and Tet2+/+ mice (Figure 4C,D). Emmprin expression levels were slightly but statistically higher in LLC cells recovered from tumors, on both a Tet2−/− compared to a Tet2+/+ background (Figure 4D). We then tested the effect in vivo of administration of an anti–Emmprin antibody to Tet2−/− or Tet2+/+ mice that had been inoculated 8 days before with LLC cells (Figure 4E). In Tet2−/− as well as Tet2+/+ mice, administration of anti–Emmprin antibody decreased the size of LLC tumors relative to mice administered isotype control (Emmprin‐treated Tet2−/− vs isotype‐treated Tet2−/− : day 16, 281.07 ± 153.49 mm3 vs 1386.30 ± 137.60 mm3, P <.001; Emmprin‐treated Tet2+/+ vs isotype‐treated Tet2+/+ : day 16, 110.92 ± 80.00 mm3 vs 329.45 ± 19.16 mm3, P < .01) (Figure 4F‐H). As a result, after the anti–Emmprin antibody treatment, the tumor size was comparable between these genotypes. These data indicate that the blockade of S100a8/s100a9‐Emmprin signaling is an effective treatment for tumors generated in immune cells with Tet2 deletion.
3.6. Multiple Vegfa‐related pathways are enriched in Lewis lung carcinoma cells sorted from tumors in Tet2−/− compared to Tet2+/+ mice
We next asked how S100a8/S100a9‐Emmprin signaling might impact LLC tumors in Tet2−/− mice. Interestingly, growth of LLC cells in vitro was unchanged by S100a8/S100a9 treatment (Figure S5A), suggesting that S100a9/S100a9 does not directly regulate LLC tumor growth. Thus, to understand how S100a8/S100a9‐Emmprin signaling initiated by Tet2‐deficient immune cells might stimulate LLC growth in vivo, we performed WTA for LLC cells purified from tumors in Tet2−/− and Tet2+/+ mice. PCA and unsupervised clustering heatmap analysis revealed a distinct gene expression pattern in LLC cells purified from Tet2−/− compared to Tet2+/+ tumors (Figure 5A and Figure S5B). When we analyzed DEG between Tet2‐deficient and WT groups (FDR P < .05) (Figure 5B,C), 318 genes were significantly upregulated and 192 downregulated in LLC cells purified from Tet2−/− tumors (Figure 5D). Analysis of genes highly expressed in LLC cells purified from Tet2−/− tumors revealed 77 genes showing at least a twofold change and 32 showing at least a threefold change (Figure 5D). Notably, expression of Vegfa, which encodes a factor that stimulates angiogenesis, was highly upregulated in LLC cells from Tet2−/− tumors (Figure 5B,C). Consistent with flow cytometric analysis shown in Figure 4D, Emmprin mRNA expression was higher in LLC cells in Tet2−/− compared to Tet2+/+ tumors (FDR P < .005), while Tlr4 and Ager mRNA expression were lower overall and comparable between genotypes (Figure S5C).
FIGURE 5.
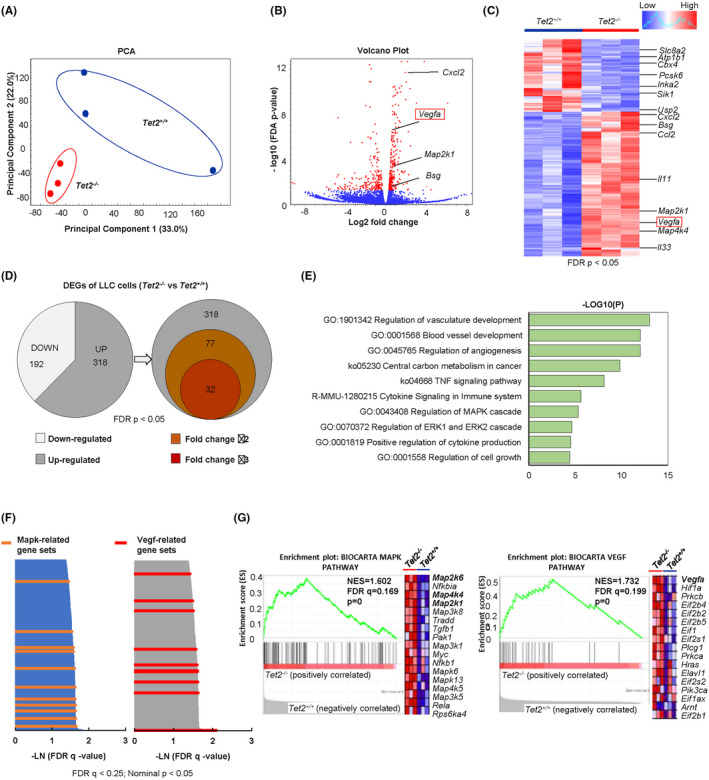
Multiple Vegfa‐related pathways are enriched in LLC cells sorted from tumors in Tet2−/− vs Tet2+/+ mice. A, A PCA plot for WTA of LLC cells sorted from tumors in Tet2−/− (n = 3) and Tet2+/+ (n = 3) mice. B, Volcano plot showing DEG . C, Heatmap of supervised clustering of DEG. D, Pie graph showing the proportion of upregulated (grey) or downregulated (white) genes (left). Venn diagram shows the number of upregulated genes only (right). E, Metascape analysis of top 10 enrichment pathways upregulated in the Tet2−/− relative to Tet2+/+ groups. F, Gene sets enriched in LLC cells from Tet2−/− relative to Tet2+/+ mice. G, GSEA of BIOCATA Vegf (left) and BIOCARTA Mapk (right) pathway for LLC cells. Tet2+/+ , n = 3; Tet2−/− , n = 3
Metascape analysis for genes highly expressed in LLC cells purified in Tet2−/− tumors indicated enrichment pathways related to blood vessel development, regulation of angiogenesis, regulation of the MAPK cascade, and regulation of ERK1 and ERK2 signaling (Figure 5E, Table S4).
We then performed GSEA of WTA data to define pathways enriched in LLC cells in Tet2−/− tumors (Figure 5F,G). Curated gene sets (C2) in the Molecular Signature Database (MSigDB) indicated significant enrichment of multiple pathways related to angiogenesis/Vegfa and ERK‐MAP kinases in LLC cells purified from tumors in Tet2−/− mice (Figure 5F,G).
3.7. Vegfa is a candidate effector of S100a8/S100a9 secreted from granulocytic myeloid‐derived cells
Based on the above findings, we hypothesized that S100a8/S100a9 stimulation might promote Vegfa expression by LLC cells. To assess this possibility, we treated LLC cells grown in vitro with S100a8/S100a9 assessed both Vegfa mRNA and protein levels (Figure S5D). S100a8/S100a9 treatment upregulated Vegfa mRNA expression in LLC cells relative to controls (Figure S5E). We also observed high levels of Vegfa protein in supernatants of S100a8/S100a9‐treated LLC cells relative to controls (Figure S5F). Then, we examined the effect of blockade of S100a8/S100a9‐Emmprin signaling using LLC cells in vitro. We found that Vegfa protein levels were decreased by treatment of anti–Emmprin antibody compared to isotype in supernatants of LLC cells stimulated by S100a8/S100a9 protein (Figure S5G).
We then established co–cultures of LLC plus either Tet2‐deficient or WT GMD sorted from tumors and assessed Vegfa protein levels in supernatants from co–cultures compared to LLC cultured alone (Figure 6A). Vegfa concentrations were significantly higher in supernatants from LLC co–cultured with GMD regardless of their genotype (Figure 6B). Furthermore, Tet2‐deficient GMD had greater ability than WT GMD to stimulate Vegfa expression form LLC cells (P < .05) (Figure 6B). Moreover, treatment of co–cultures with anti–Emmprin antibody decreased Vegfa protein levels in supernatants from both LLC/Tet2‐deficient GMD and LLC/WT GMD sorted from tumors (Figure 6C). These data suggest that Vegfa could be an effector of S100a8/S100a9 in this system.
FIGURE 6.
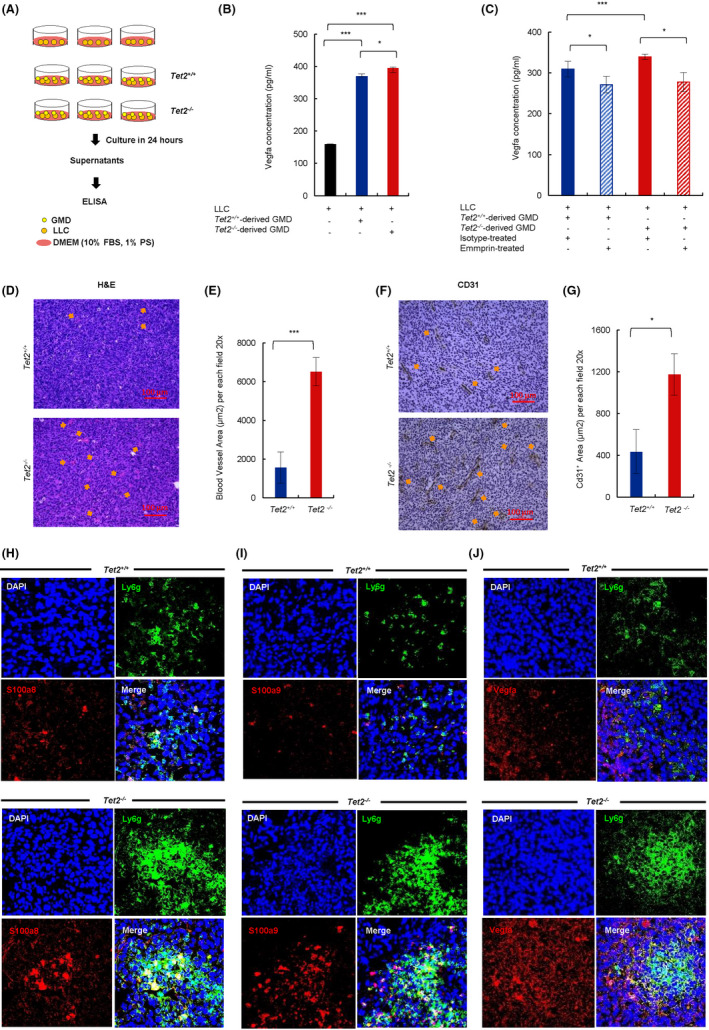
Co–culture and in vivo analysis of S100a8/S100a9‐expressing myeloid cell effects on Vegfa expression and vasculatures in Tet2−/− tumors. A, Experimental schema. B, Vegfa concentrations in supernatants (n = 3) 24 h after co–culture of LLC with Tet2‐deficient or WT GMD. C, Vegfa protein in supernatants with anti–Emmprin or isotype control (n = 3). D, Hematoxylin‐eosin (HE) staining of tumor sections. Tet2−/− , n = 3; Tet2+/+ n = 3. Orange arrows, blood vessels. Scale bars, 100 μm. E, Blood vessel area per each field at 20× magnification. Tet2−/− , n = 3; Tet2+/+ n = 3. F, Immunohistochemical staining of tumor sections with anti–Cd31 antibody. Tet2−/− , n = 3; Tet2+/+ n = 3. Orange arrows indicate Cd31+ area. G, Cd31+ area for each field at 20× magnification. Tet2−/− , n = 3; Tet2+/+ n = 3. H, I, and J, Immunofluorescent analysis of tumor sections from Tet2−/− (lower rows) and Tet2+/+ (upper rows) mice stained for Ly6g plus S100a8 (H), S100a9 (I), or Vegfa (J). DAPI served as a nuclear stain. Tet2+/+ , n = 4; Tet2−/− , n = 4. For all panels, *P < .05; **P < .01; ***P < .005; ns, not significant
Next, we examined S100A8/S100A9 expression in 43 human lung cancer lines using microarray data. Although a few cell lines harboring EGFR mutations (HCC827 and H1650) or ALK translocations (H2228) showed high S100A8/S100A9 expression, most expressed low levels of both S100A8 and S100A9 (Figure S5H). We next treated the human lung cancer lines A549 and LC‐Ad‐1 with S100A8/S100A9 in vitro and assessed VEGFA protein levels in supernatants. Those levels significantly increased in both lines following S100A8/S100A9 treatment (P < .05) (Figure S5I), supporting the idea that S100A8/S100A9 may upregulate VEGFA secretion by human lung cancer cells in addition to LLC.
3.8. Lewis lung carcinoma tumors in Tet2−/− mice exhibit enhanced vascularization relative to Tet2+/+ tumors
Given that Vegfa promotes angiogenesis, we undertook histological and immunohistochemical comparison of vascular structures in LLC tumors in Tet2−/− mice with those in Tet2+/+ mice. Based on hematoxylin and eosin (HE) staining, the area occupied by blood vessels in Tet2−/− tumors increased threefold compared to that seen in Tet2+/+ tumors (P < .005) (Figure 6D,E). Accordingly, the area stained by an anti–CD31 antibody in tumor sections increased threefold in tumors from Tet2−/− compared to Tet2+/+ mice (P < .05) (Figure 6F,G).
Then, we examined vascular structures in LLC tumors in Tet2−/− mice with those in Tet2+/+ mice treated with anti–Emmprin antibody or isotype control. Based on HE staining, the area occupied by blood vessels in Tet2−/− tumors with anti–Emmprin group decreased at twofold compared to that seen in the isotype group (P < .05) (Figure S5J). In Tet2+/+ tumors, however, there was not significant difference between anti–Emmprin and isotype groups, although the blood vessel area tended to be smaller in the anti–Emmprin group than that in the isotype group (Figure S5J).
3.9. Immunostaining of tumor tissues shows high S100a8/S100a9 expression in granulocytic myeloid‐derived from Tet2−/− mice
To compare localization of S100a8/S100a9 protein with GMD markers in tumors, we stained tumor sections from Tet2−/− and Tet2+/+ mice with an antibody to Ly6g (a GMD marker) plus either anti–S100a8 or S100a9 antibodies. We observed an increase in large foci (>1000 px2) consisting of Ly6g‐positive cells in tumor sections from Tet2−/− relative to Tet2+/+ mice (Figure 6H,I, and Figure S5K), and cells were also positive for S100a8 and S100a9 (Figure 6H,I, and Figure S5L). Vegfa expression also increased in tumor sections in Tet2−/− compared to Tet2+/+ mice (Figure 6J and Figure S5L). Vegfa‐highly positive LLC cells exist surrounding Ly6g+ GMD large foci in tumor sections in Tet2−/− mice (Figure 6J).
These data suggest overall that Tet2‐deficient GMD cells expressing S100a8 and S100a9 infiltrate tumors and may stimulate Vegfa production by LLC cells, enhancing tumor vascularization.
4. DISCUSSION
Here, we present evidence that signaling through the S100a8/S100a9‐Emmprin‐Vegfa axis is essential for progression of a lung cancer model established in a microenvironment of Tet2‐deficient immune cells. Specifically, we propose that S100a8/S100a9 secreted from Tet2‐deficient myeloid subclusters, especially GMD, stimulates the Emmprin receptor expressed on lung cancer cells, which then secrete Vegfa, further promoting tumor angiogenesis.
TET2 encodes a dioxygenase catalyzing 5‐methylcytosine (5mC) into 5‐hydroxymethylcytosine (5hmC) and then to 5‐formylcytosine (5fC) and 5‐carboxylcytosine (5caC). TET2 protein plays roles in a variety of epigenetic regulations, such as the DNA demethylation process. 7 , 15 , 16 Tet2 deficiency has been reported to result in loss of hypermethylation, leading to a global change in gene expressions. It remains to be elucidated if upregulation of mediators in Tet2‐deficient immune cells in our studies is the direct effect of a dynamic change in DNA modification status. Interleukin‐1b (Il1b) signaling was identified as a candidate upstream of S100a8/S100a9 (Supplementary Notes, Figure S6, Table S5), suggesting that Tet2 deficiency may lead to the S100a8/S100a9‐Emmprin‐Vegfa axis through modifying Il1b signaling.
Loss of function TET2 mutations are found in a wide variety of blood cancers in addition to clonal hematopoiesis. 15 Deletion of Tet2 in the blood system resulted in myeloid cancer development after long latencies in mice, confirming its role as a tumor suppressor. 5 , 15 In solid cancers, previous analyses of melanoma 7 and liver cancer 8 models indicated that Tet2‐deficient MDSC modulate cancer progression by altering T cell‐mediated immunity, although they played opposite roles in T‐cell recruitment in each model. Intriguingly, our findings in a lung cancer model strongly suggest that Tet2‐deficient myeloid cells alter activity of a vascular niche for tumor cells rather than directly altering T‐cell mediated immunity. Overall, these data suggest that the effects of TET2‐mutated clonal hematopoiesis in development of solid tumors is context‐dependent.
S100a8 and S100a9, both S100 family proteins, are primarily secreted by myeloid lineage cells and biochemically form S100a8/a9 heterodimers. 12 , 13 , 17 S100a8/S100a9 reportedly modulate various inflamatory processes. 13 , 18 , 19 Oncogenic functions of S100a8/S100a9 are also reported in breast, lung, gastric, and colon cancers. 12 , 19 , 20 , 21 , 22 Multiple S100a8/S100a9 receptors, including Emmprin, Tlr4, and RAGE, have been identified and their differential activity may underlie the diverse roles played by S100a8/S100a9 in cancer progression, such as proliferation, metastasis, and angiogenesis. 12 , 13 , 22 In our model, Emmprin expressed on lung cancer cells functions as a S100s8/s100a9 receptor and could serve as a therapeutic target. Emmprin is a cell‐surface glycoprotein of the immunoglobulin superfamily, 23 and its effectors are known to be matrix metalloproteinases (MMP) 24 and VEGF, 25 which, respectively, promote tumor invasion and angiogenesis. In our model, Vegfa, rather than MMP, mediate Emmprin signaling based on our observation that MMP expression levels in LLC cells were unchanged following Tet2 deletion in immune cells (Table S6). Notably, however, vascular structures and angiogenesis were very clearly different between Tet2−/− and WT tumors, although the Vegfa protein levels were marginally different with or without S100a/S100a9 stimulation. These data suggest that pathways besides the S100a8/S100a9‐Emmrpin‐Vegfa axis may also contribute to tumor angiogenesis in Tet2−/− tumors. Notably, high expression of S100A8, S100A9, EMMPRIN, or VEGFA genes is associated with the prognosis of human lung cancer patients (Supplementary Notes, Figure S7).
Our study reveals how TET2‐mutated immune cells derived from clonal hematopoiesis function as microenvironmental cells in the development of solid cancers, a finding that could suggest new therapeutic targets. Moreover, this work contributes to precision medicine approaches, as it proposes a means to stratify treatments based on somatic mutations in immune cells as well in cancer cells.
DISCLOSURE
M. Sakata‐Yanagimoto has received research funds from Eisai, Bristol Myers Squibb, Mundi Pharma. S. Chiba has received commercial research support from Astellas, Ono Pharmaceutical, Kyowa Kirin, Chugai Pharmaceutical, and Bayer. No potential conflicts of interest were disclosed by the other authors.
Supporting information
Supplementary Material
ACKNOWLEDGMENTS
We thank Hiroko Kunifuda and Yukari Sakashita for technical assistance, Ayako Suzuki and Yutaka Suzuki (the University of Tokyo) for advice on computational analysis of scRNA‐seq data, and Prof. Oliver A Bernard for the Tet2flox/flox mouse line. Finally, we acknowledge Dr Elise Lamar for outstanding editorial assistance. This work was supported by Grants‐in‐Aid for Scientific Research (KAKENHI: JP20K21535 and JP21H02945 to MS‐Y., JP19H03683 to SC, JP20J20851 to YA, JP21K16262 to YS, and JP21K15478 to TBN) from the Ministry of Education, Culture, Sports, and Science of Japan, AMED under Grant Numbers JP18ck0106443h001 and JP21ck0106XXXh000X (to MS‐Y.), and the MSD Life Science Foundation, Mochida Memorial Foundation for Medical and Pharmaceutical Research, Princess Takamatsu Cancer Research Fund, the Uehara Memorial Foundation, and the Naito Foundation (to MS‐Y.).
Nguyen YTM, Fujisawa M, Nguyen TB, et al. Tet2 deficiency in immune cells exacerbates tumor progression by increasing angiogenesis in a lung cancer model. Cancer Sci. 2021;112:4931–4943. 10.1111/cas.15165
REFERENCES
- 1. Gabrilovich DI. Myeloid‐derived suppressor cells. Cancer Immunol Res. 2017;5:3‐8. [DOI] [PMC free article] [PubMed] [Google Scholar]
- 2. Genovese G, Kähler AK, Handsaker RE, et al. Clonal hematopoiesis and blood‐cancer risk inferred from blood DNA sequence. N Engl J Med. 2014;371:2477‐2487. [DOI] [PMC free article] [PubMed] [Google Scholar]
- 3. Jaiswal S, Fontanillas P, Flannick J, et al. Age‐related clonal hematopoiesis associated with adverse outcomes. N Engl J Med. 2014;371:2488‐2498. [DOI] [PMC free article] [PubMed] [Google Scholar]
- 4. Coombs CC, Zehir A, Devlin SM, et al. Therapy‐related clonal hematopoiesis in patients with non‐hematologic cancers is common and associated with adverse clinical outcomes. Cell Stem Cell. 2017;21:374‐82.e4. [DOI] [PMC free article] [PubMed] [Google Scholar]
- 5. Park SJ, Bejar R. Clonal hematopoiesis in cancer. Exp Hematol. 2020;83:105‐112. [DOI] [PMC free article] [PubMed] [Google Scholar]
- 6. Nguyen TB, Sakata‐Yanagimoto M, Asabe Y, et al. Identification of cell‐type‐specific mutations in nodal T‐cell lymphomas. Blood Cancer J. 2017;7:e516. [DOI] [PMC free article] [PubMed] [Google Scholar]
- 7. Pan W, Zhu S, Qu K, et al. The DNA methylcytosine dioxygenase Tet2 sustains immunosuppressive function of tumor‐infiltrating myeloid cells to promote melanoma progression. Immunity. 2017;47:284‐97.e5. [DOI] [PMC free article] [PubMed] [Google Scholar]
- 8. Li S, Feng J, Wu F, et al. TET2 promotes anti–tumor immunity by governing G‐MDSCs and CD8. EMBO Rep. 2020;21:e49425. [DOI] [PMC free article] [PubMed] [Google Scholar]
- 9. Quivoron C, Couronne L, Della Valle V, et al. TET2 inactivation results in pleiotropic hematopoietic abnormalities in mouse and is a recurrent event during human lymphomagenesis. Cancer Cell. 2011;20:25‐38. [DOI] [PubMed] [Google Scholar]
- 10. Kuhn R, Schwenk F, Aguet M, Rajewsky K. Inducible gene targeting in mice. Science. 1995;269:1427‐1429. [DOI] [PubMed] [Google Scholar]
- 11. Clausen BE, Burkhardt C, Reith W, Renkawitz R, Forster I. Conditional gene targeting in macrophages and granulocytes using LysMcre mice. Transgenic Res. 1999;8:265‐277. [DOI] [PubMed] [Google Scholar]
- 12. Tomonobu N, Kinoshita R, Sakaguchi M. S100 soil sensor receptors and molecular targeting therapy against them in cancer metastasis. Transl Oncol. 2020;13:100753. [DOI] [PMC free article] [PubMed] [Google Scholar]
- 13. Pruenster M, Vogl T, Roth J, Sperandio M. S100A8/A9: from basic science to clinical application. Pharmacol Ther. 2016;167:120‐131. [DOI] [PubMed] [Google Scholar]
- 14. Bullock BL, Kimball AK, Poczobutt JM, et al. Tumor‐intrinsic response to IFNγ shapes the tumor microenvironment and anti–PD‐1 response in NSCLC. Life Sci Alliance. 2019;2:e201900328. [DOI] [PMC free article] [PubMed] [Google Scholar]
- 15. Jiang S. Tet2 at the interface between cancer and immunity. Commun Biol. 2020;3:667. [DOI] [PMC free article] [PubMed] [Google Scholar]
- 16. Chiba S, Sakata‐Yanagimoto M. Advances in understanding of angioimmunoblastic T‐cell lymphoma. Leukemia. 2020;34:2592‐2606. [DOI] [PMC free article] [PubMed] [Google Scholar]
- 17. Wang S, Song R, Wang Z, Jing Z, Ma J. S100A8/A9 in inflammation. Front Immunol. 2018;9:1298. [DOI] [PMC free article] [PubMed] [Google Scholar]
- 18. Simard JC, Cesaro A, Chapeton‐Montes J, et al. S100A8 and S100A9 induce cytokine expression and regulate the NLRP3 inflammasome via ROS‐dependent activation of NF‐κB(1.). PLoS One. 2013;8:e72138. [DOI] [PMC free article] [PubMed] [Google Scholar]
- 19. Song R, Struhl K. S100A8/S100A9 cytokine acts as a transcriptional coactivator during breast cellular transformation. Sci Adv. 2021;7:eabe5357. [DOI] [PMC free article] [PubMed] [Google Scholar]
- 20. Kwon CH, Moon HJ, Park HJ, Choi JH, Park DY. S100A8 and S100A9 promotes invasion and migration through p38 mitogen‐activated protein kinase‐dependent NF‐κB activation in gastric cancer cells. Mol Cells. 2013;35:226‐234. [DOI] [PMC free article] [PubMed] [Google Scholar]
- 21. Ichikawa M, Williams R, Wang L, Vogl T, Srikrishna G. S100A8/A9 activate key genes and pathways in colon tumor progression. Mol Cancer Res. 2011;9:133‐148. [DOI] [PMC free article] [PubMed] [Google Scholar]
- 22. Bresnick AR, Weber DJ, Zimmer DB. S100 proteins in cancer. Nat Rev Cancer. 2015;15:96‐109. [DOI] [PMC free article] [PubMed] [Google Scholar]
- 23. Hibino T, Sakaguchi M, Miyamoto S, et al. S100A9 is a novel ligand of EMMPRIN that promotes melanoma metastasis. Cancer Res. 2013;73:172‐183. [DOI] [PubMed] [Google Scholar]
- 24. Guo H, Zucker S, Gordon MK, Toole BP, Biswas C. Stimulation of matrix metalloproteinase production by recombinant extracellular matrix metalloproteinase inducer from transfected Chinese hamster ovary cells. J Biol Chem. 1997;272:24‐27. [PubMed] [Google Scholar]
- 25. Tang Y, Nakada MT, Kesavan P, et al. Extracellular matrix metalloproteinase inducer stimulates tumor angiogenesis by elevating vascular endothelial cell growth factor and matrix metalloproteinases. Cancer Res. 2005;65:3193‐3199. [DOI] [PubMed] [Google Scholar]
Associated Data
This section collects any data citations, data availability statements, or supplementary materials included in this article.
Supplementary Materials
Supplementary Material


