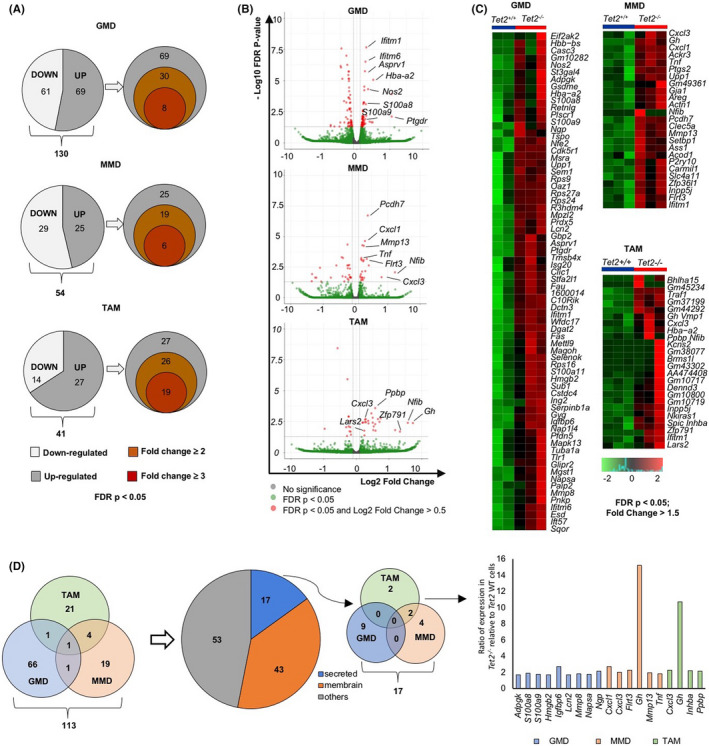
FIGURE 2.

WTA reveals candidate mediators of LLC growth expressed in Tet2‐deficient myeloid cells. A, Pie graphs showing the number of upregulated (grey) or downregulated (white) genes for Tet2‐deficient vs WT GMD, MMD and TAM (left). Venn diagrams show numbers of corresponding upregulated genes (right). B, Volcano plots of DEG. C, Heatmaps of supervised clustering of DEG. D, Venn diagrams of genes upregulated in GMD, MMD. and TAM. DAVID analysis (https://david.ncifcrf.gov/) were used to classify genes encoding secreted proteins (blue), membrane proteins (orange), or others (grey). In the Venn diagram, genes encoding secreted proteins are shown. Bar chart shows gene list and ratio of expression in Tet2‐deficient relative to WT cells
