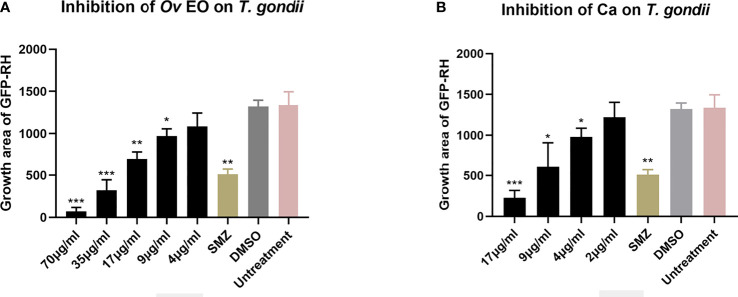
Figure 4.
Statistical analysis of the inhibition effect of Ov EO and Ca in anti-T. gondii. Data analysis based on fluorescence area of GFP-RH. Each bar represents the mean ± SD of three wells per group. *P < 0.05, **P < 0.01, ***P < 0.001 compared with untreatment group. (A) Anti-T. gondii activity of Ov EO, and (B) Anti-T. gondii activity of Ca.

