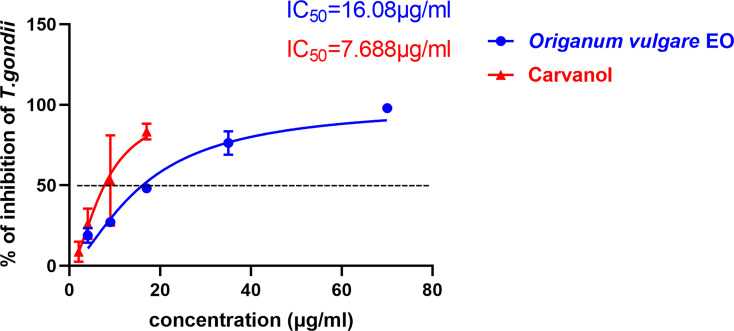
Figure 5.
The 50% inhibition concentrations (CC50) of Ov EO and Ca. Inhibition of Ov EO and Ca to T. gondii. Different concentrations of Ov EO and Ca treated infected HFF cells for 32 h, the growth of GFP-RH was observed and photographed under a fluorescence microscope. Growth of GFP-RH was calculated using Image-Pro-Express. All data are presented as with error bars and the experiments were performed in triplicate.

