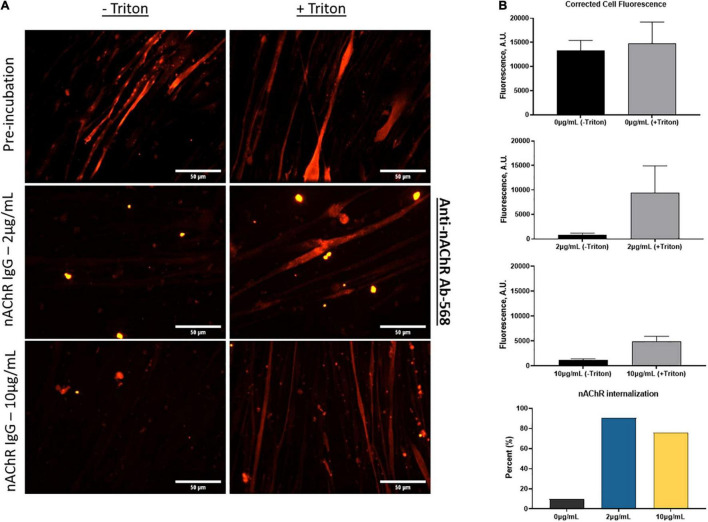
FIGURE 4.
Anti-nAChR Abs induce receptor internalization. (A) ICC images of SKM stained for anti-nAChR Ab with and without triton (top panel), incubated with 2 μg/mL or 10 μg/mL anti-nAChR Ab, middle and bottom panels, respectively, and later fixed and blocked with and without triton. Scale bars = 50 microns. (B) The corrected total cell fluorescence between the surface receptors (black bars) and internalized receptors (gray bars) for each condition. The percent change in fluorescence is represented as a bar graph for nAChR internalization.

