Figure 3.

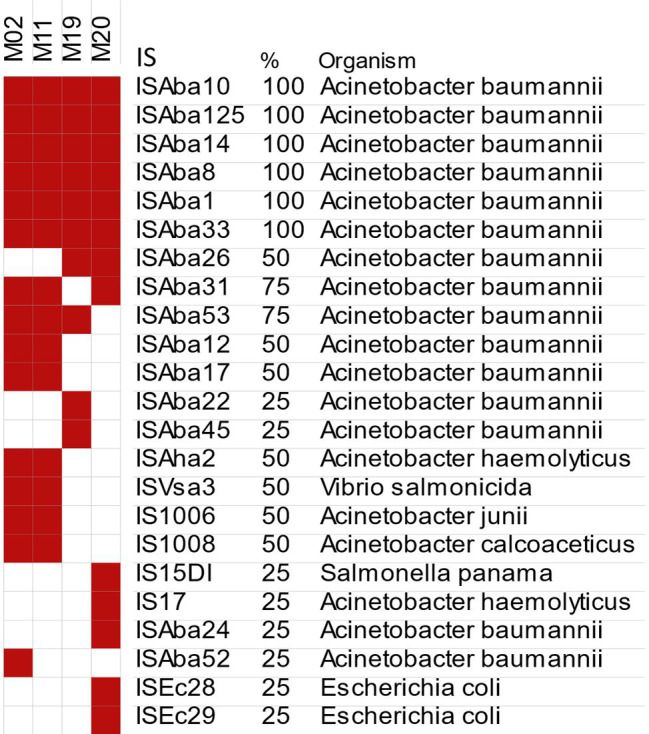
Genome-wide distribution of different IS elements in the blaNDM-positive isolates predicted by ISfinder. Red and white colors denote the presence and absence of each IS element, respectively.

Genome-wide distribution of different IS elements in the blaNDM-positive isolates predicted by ISfinder. Red and white colors denote the presence and absence of each IS element, respectively.