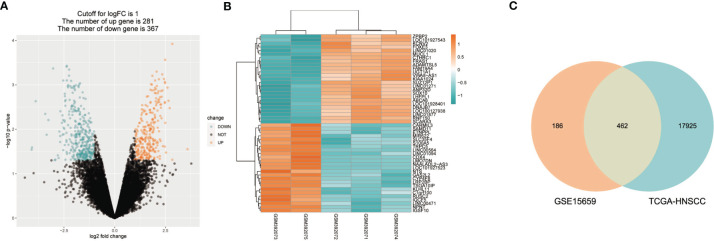
Figure 2.
Treg-related mRNA extraction from RNA expression profiles. (A) GSE15659 differential gene expression volcano map, screening criteria I log2FC I > 1 and P < 0.05. ln blue are down-regulated transcripts and in red are up-regulat ed transcripts. (B) Top 50 differential transcripts extracted from GSE15659 shown using heatmap, where blue represents down-regulated transcripts and red up-regulated transcripts. (C) Venn Diagram of 462 overlapped mRNAs found in 648 differential expression transcripts from GSE15659 and 18392 mRNA from TCGA-HNSCC.

