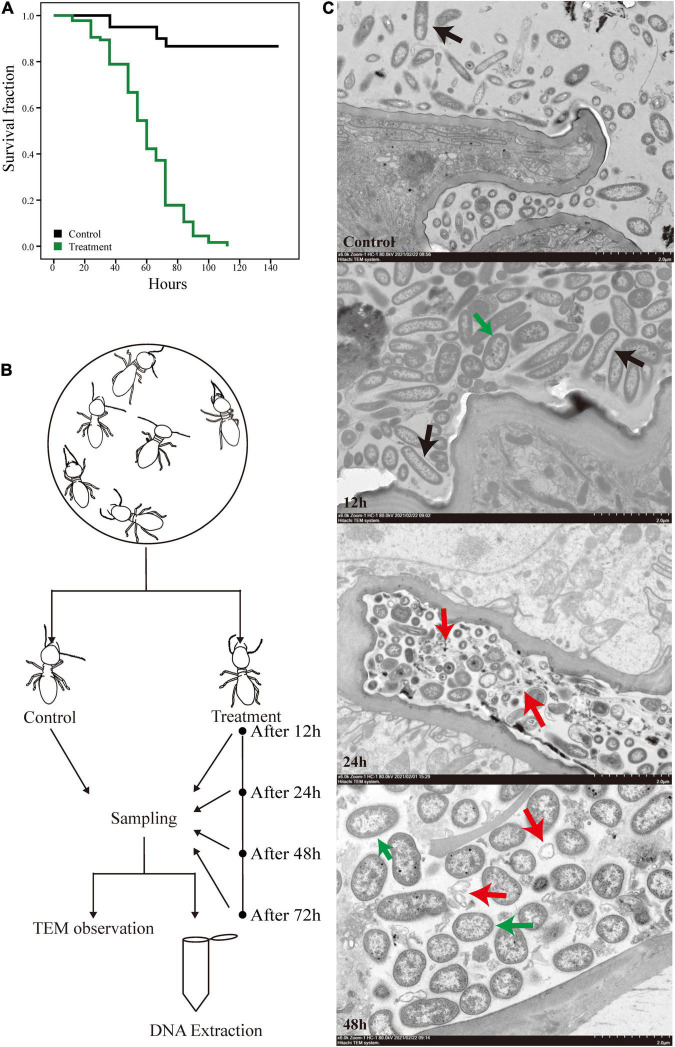
FIGURE 1.
Experimental design and the survival curves of O. formosanus during M. robertsii infection. (A) Kaplan–Meier survival curve of fungus treatment and control groups. (B) Experimental design. (C) Transmission electron microscopy (TEM) images of the hindguts of individuals from treatment groups after 12, 24, and 48 h of M. robertsii infection, in addition to those of individuals from uninfected control groups. All images were captured from a HITACHI transmission electron microscope (Model HT7800; scale bar: 2 μm). Black arrows: gut microorganisms in the form of long strips or pikes; red arrows: microorganism lysis debris; green arrows: M. robertsii spores.

