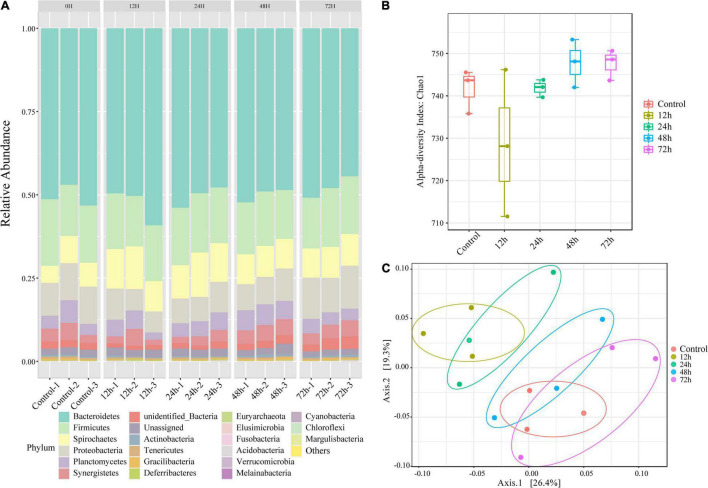
FIGURE 2.
Changes in the composition of O. formosanus gut microbiome following M. robertsii infection based on 16S rRNA sequencing data. (A) Relative abundances of gut microbes at the phylum level. There are five clusters, each including three independent repetitions. Each bar graph demonstrates the microbial community composition of one independent repetition in the corresponding group. (B) Alpha-diversity comparison based on the Chao1 diversity index. (C) Principal coordinate analysis of gut microbial community composition was based on unweighted UniFrac distance. Three replications of the same treatment group were represented by dots of the same color. There were four treatment groups and one control group.

