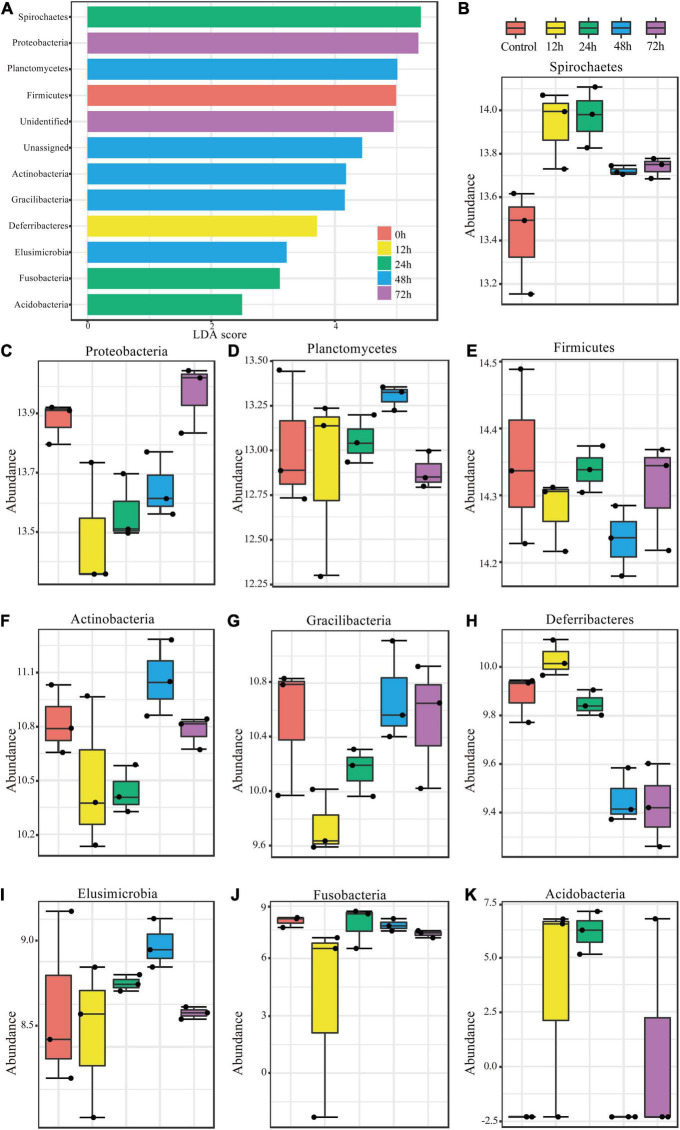
FIGURE 3.
Significant changes in phylum abundances and their specific trends over time. (A) Linear discriminant analysis (LDA) combined with effect size measurements (LEfSe) was used to screen qualified OTUs. They showed statistically different strains with LDA scores greater than a prespecified value of 2. Different colors refer to different time periods. (B–K) Relative abundances over time of the significantly different phyla.

