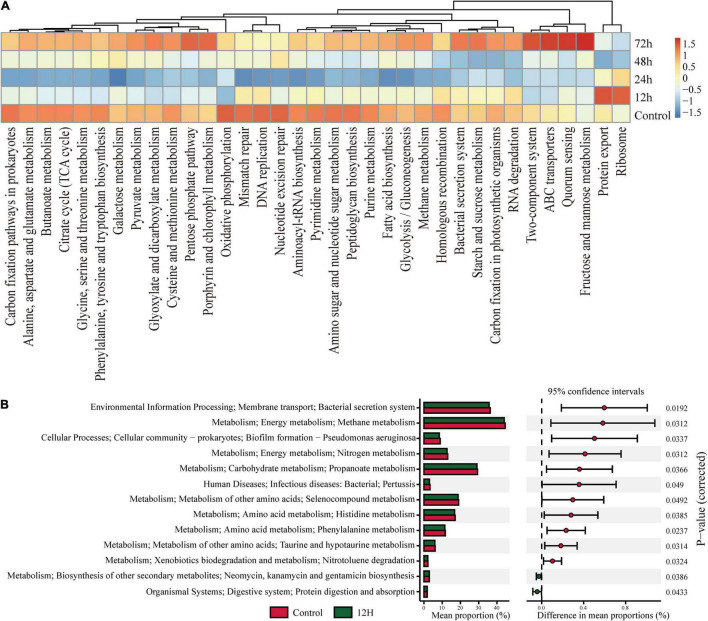
FIGURE 5.
KEGG Orthology (KO) pathway enrichment among experimental groups. Q-value is used as a corrected P-value ranging from 0.0 to 1.0. Low Q-values indicate greater intensity (enrichment). (A) Heat map showed abundances of KO labels. The results were picked with minimum value of the BCR. (B) Prediction of KEGG pathways between control and treatment groups as detected by STAMP software. Differential KEGG pathways between the control group and the treatment group after infection at 12 h. For each comparison, the mean proportion of predicted KEGG pathways (left) and difference in mean proportions (right) were illustrated.

