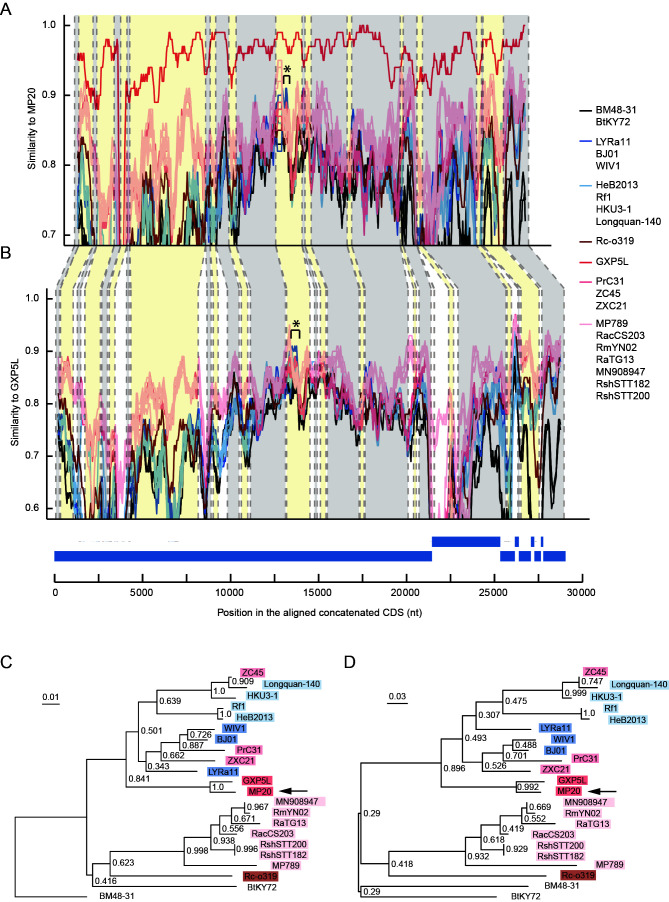
Figure 3.
Recombination analysis of the pangolin-CoV-GXC sublineage
A: Similarity plot comparing 21 viruses related to MP20 from successfully captured coding sequences (CDSs). *: Region for which a recombination signal was detected. SC2r-CoVs are displayed in warm colors, and SARSr-CoVs are displayed in cool colors. B: Similarity plot comparing 20 viruses related to the pangolin-CoV GXP5L. *: Region for which a recombination signal was detected. C, D: Neighboring-joining phylogenetic trees for regions with a recombination signal based on all positions (C) and based on only the third positions (D) in the codons. The bootstrap values calculated from 1000 replicates and branch scale bars are shown.

