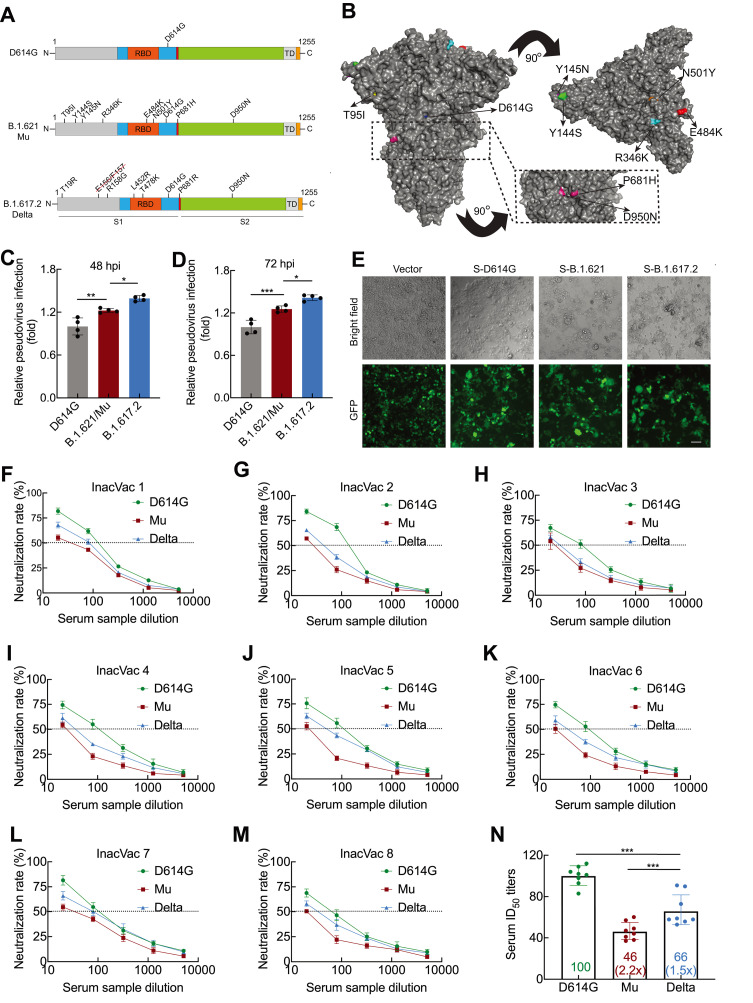
Figure 1.
Infectivity and neutralizing activity of immune serum for Mu variant
A: Diagram of SARS-CoV-2 spike protein from D614G, B.1.621/Mu, and B.1.617.2/Delta variants. D614G variant pseudovirus (containing D614G spike mutation); B.1.621/Mu variant pseudovirus (containing T95I, Y144S, Y145N, R346K, E484K, N501Y, D614G, P681H, and D950N spike mutations); B.1.617.2/Delta variant pseudovirus (containing E156 and F157 deletions and T19R, R158G, L452R, T478K, D614G, P681R, and D950N spike mutations). B: Surface representation of SARS-CoV-2 B.1.621/Mu spike trimer (PDB: 6ZGE). Black dashed box indicates location of P681H and D950N. C, D: Infectivity of D614G, B.1.621/Mu, and B.1.617.2/Delta variant pseudoviruses assessed in HEK293T-ACE2 cells. Cells were inoculated with equivalent doses of each pseudotyped virus. At 12 h post-inoculation, supernatants were replaced with fresh culture medium. At 48 (C) and 72 h (D), cells were lysed and analyzed for firefly luciferase activity. Data are mean±standard deviation (SD). n=4. *: P<0.05,**: P<0.01, and***: P<0.001 were calculated by one-way analysis of variance (ANOVA) followed by Tukey’spost hoc test. E: Quantitative cell-cell fusion assay. HEK193T cells expressing SARS-CoV-2 spike variants D614G, B.1.621/Mu, and B.1.617.2/Delta were mixed with ACE2-expressing target HEK293T cells (ratio 1:1), and cell-cell fusion was analyzed by measuring presence of syncytia by fluorescence microscopy. F–N: Neutralizing activity of inactivated vaccine serum to D614G, B.1.621/Mu, and B.1.617.2/Delta variants. Pseudotypes were incubated with different serum dilutions for 60 min at 37 °C, and then incubated with HEK293T-ACE2 cells. At 72 h, cells were lysed and analyzed for firefly luciferase activity. Assay of each serum sample was performed in triplicate to determine 50% neutralization titer, as reflected by black dashed line (F–M). Each data point in N represents 50% neutralization titer obtained with a serum sample against indicated pseudovirus. Bar graphs indicate geometric mean titers (GMTs) with 95% confidence. Numbers within box indicate average fold-change in neutralization resistance of indicated spike variants compared to D614G variant in each serum sample (N). n=8. ***: P<0.001 was calculated by one-way ANOVA followed by Tukey’spost hoc test.

