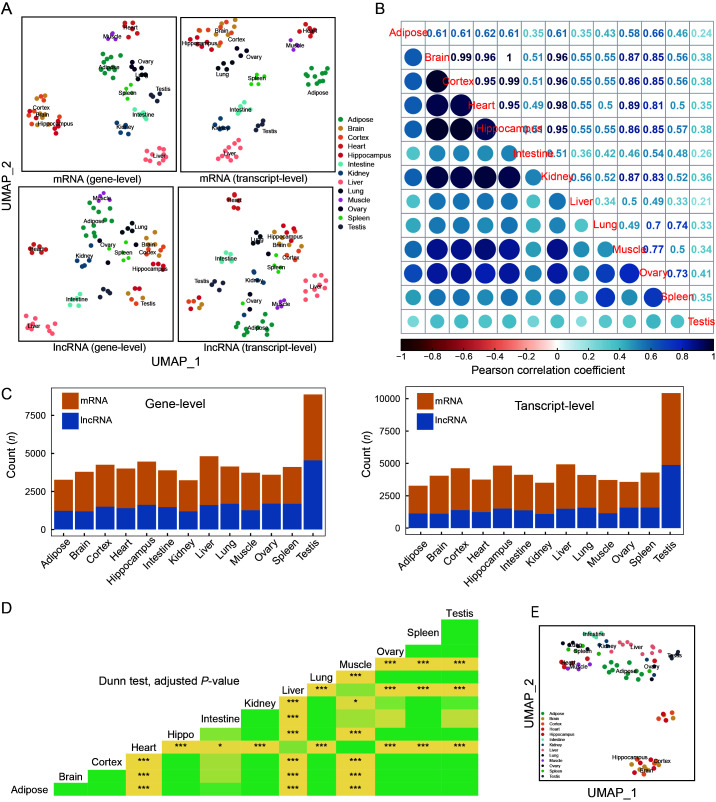
Figure 3.
Tissue expression and alternative splicing profiles of tree shrew TS_3.0 transcripts
A: Tissue expression profiles of mRNAs and lncRNAs annotated in TS_3.0 at gene level (left panel) and transcript level (right panel). UMAP_1, UMAP dimension 1; UMAP_2, UMAP dimension 2. Detailed information on RNA-seq datasets of 13 tree shrew tissues is listed in Supplementary Tables S1, S2. B: Expression correlation matrix among different tree shrew tissues based on expression levels of mRNAs and lncRNAs. C: Tissue-specific expression patterns of mRNAs and lncRNAs at gene level (left) and transcript level (right). D: Comparison of PSI across 13 tree shrew tissues. P-value was calculated based on Dunn test and adjusted by Benjamini-Hochberg method. *: Padjust<0.05;***: Padjust<0.0005. Different colors indicate differentPadjust values in triangle map. E: UMAP was constructed based on PSI of each gene in 13 tree shrew tissues.

